
Download in PDF and JPG format
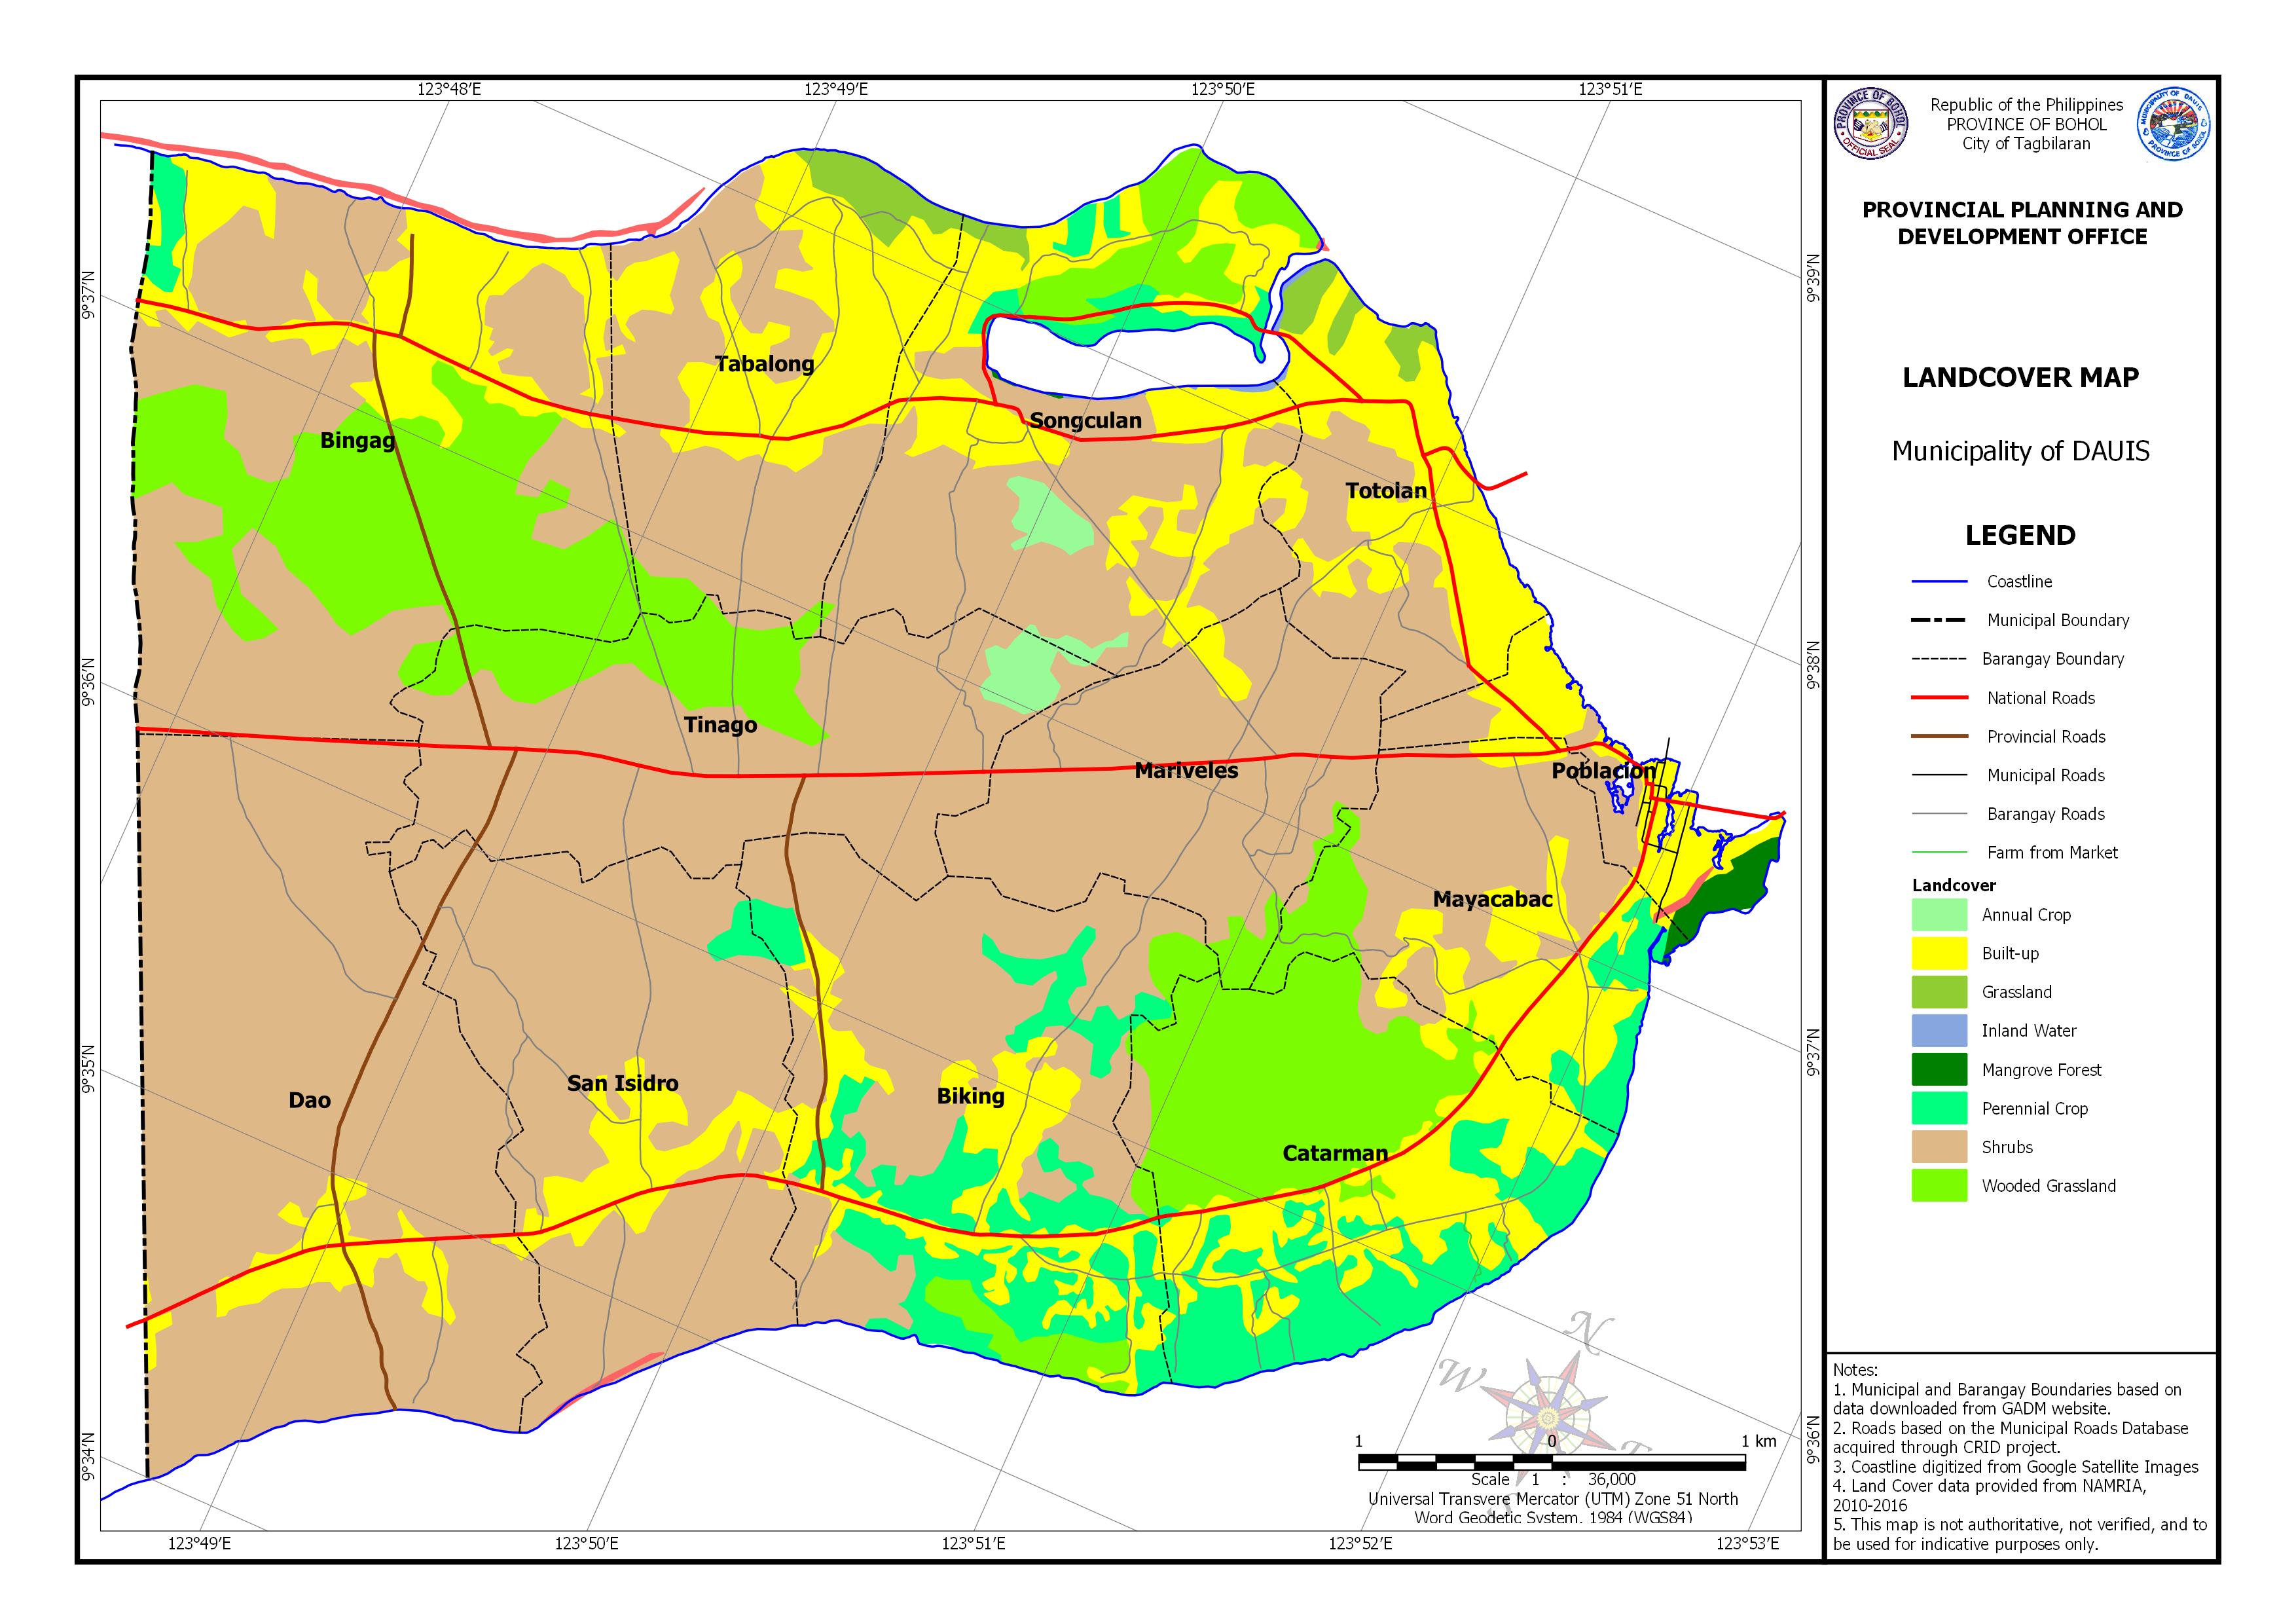
AREA EXPOSED TO LAND COVER BY BARANGAY
| Barangay | Area | Annual Crop | Built-up | Grassland | Inland Water | Mangrove Forest | Perennial Crop | Shrubs | Wooded Grassland | ||||||||
| (Hectares) | (Hectares) | Percentage | (Hectares) | Percentage | (Hectares) | Percentage | (Hectares) | Percentage | (Hectares) | Percentage | (Hectares) | Percentage | (Hectares) | Percentage | (Hectares) | Percentage | |
| Biking | 637.543 | 87.388 | 13.71% | 128.946 | 20.23% | 238.749 | 37.45% | 33.902 | 5.32% | ||||||||
| Bingag | 319.378 | 117.066 | 36.65% | 10.284 | 3.22% | 288.474 | 90.32% | 221.250 | 69.28% | ||||||||
| Catarman | 425.780 | 98.811 | 23.21% | 111.317 | 26.14% | 12.032 | 2.83% | 158.708 | 37.28% | ||||||||
| Dao | 201.105 | 41.005 | 20.39% | 578.826 | 287.82% | ||||||||||||
| Mariveles | 245.550 | 0.001 | 6.782 | 2.76% | 240.594 | 97.98% | 12.031 | 4.90% | |||||||||
| Mayacabac | 380.868 | 79.605 | 20.90% | 1.351 | 0.004 | 25.063 | 6.58% | 115.170 | 30.24% | 24.347 | 6.39% | ||||||
| Poblacion | 489.508 | 50.172 | 10.25% | 12.061 | 0.025 | 0.024 | 0.01% | 25.501 | 5.21% | ||||||||
| San Isidro | 409.841 | 53.293 | 13.00% | 5.666 | 1.38% | 350.882 | 85.61% | ||||||||||
| Songculan | 619.836 | 15.179 | 2.400% | 131.297 | 21.18% | 4.456 | 0.007 | 1.483 | 0.002 | 0.690 | 0.001 | 24.737 | 3.99% | 192.816 | 31.11% | 53.046 | 8.56% |
| Tabalong | 376.656 | 129.136 | 34.29% | 18.805 | 0.05 | 159.876 | 42.45% | 9.375 | 2.49% | ||||||||
| Tinago | 259.407 | 13.905 | 5.400% | 291.813 | 112.49% | 70.937 | 27.35% | ||||||||||
| Totolan | 88.749 | 113.104 | 127.44% | 15.238 | 0.172 | 0.984 | 0.011 | 71.563 | 80.64% | ||||||||
| Total | 4454.220 | 29.085 | 7.809% | 907.658 | 323.78% | 38.499 | 22.88% | 2.467 | 1.35% | 14.102 | 2.93% | 306.037 | 61.55% | 2566.296 | 904.15% | 583.595 | 161.55% |