
Download in PDF and JPG format
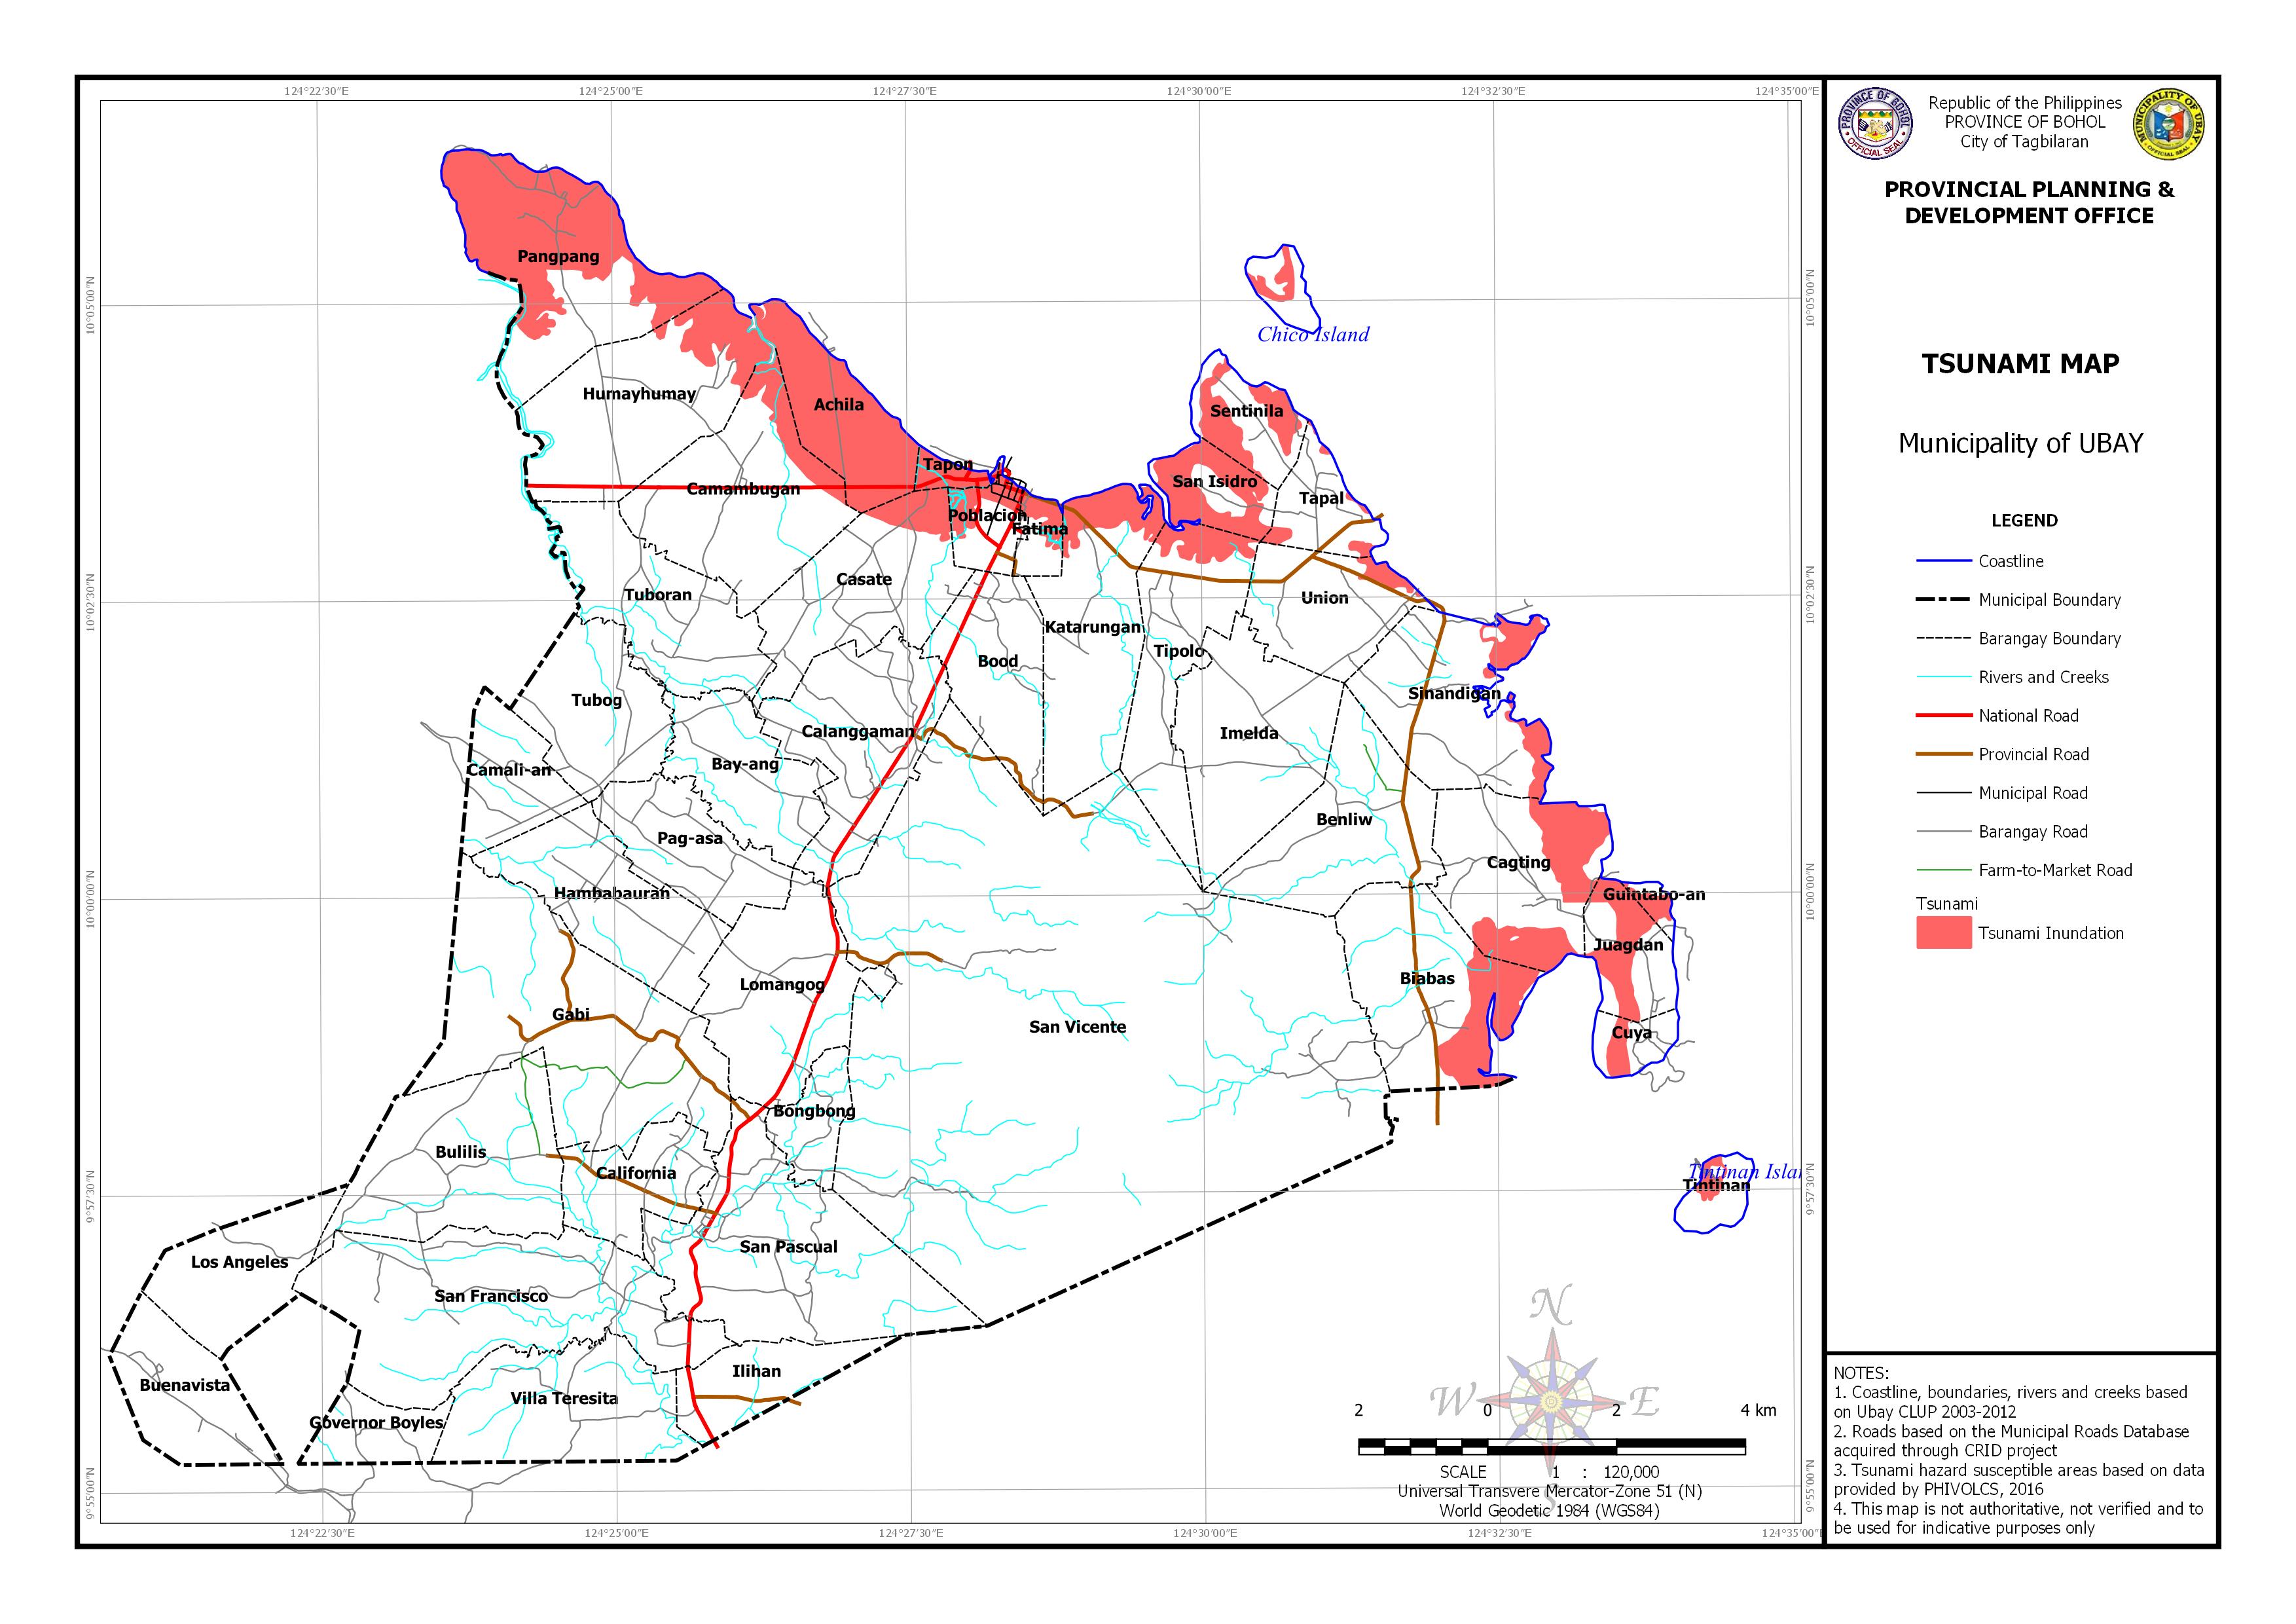
AREA EXPOSED TO TSUNAMI BY BARANGAY
| Barangay | Area | Area Exposed to Tsunami Inundation | |
| (Hectares) | (Hectares) | Percentage | |
| Achila | 368.967 | 366.451 | 99.32% |
| Biabas | 651.773 | 157.558 | 24.17% |
| Cagting | 599.799 | 195.326 | 32.57% |
| Camambugan | 719.742 | 84.292 | 11.71% |
| Casate | 583.765 | 62.734 | 10.75% |
| Cuya | 104.24 | 23.518 | 22.56% |
| Fatima | 79.998 | 30.799 | 38.50% |
| Guintabo-an | 34.34 | 18.115 | 52.75% |
| Humayhumay | 739.16 | 112.129 | 15.17% |
| Juagdan | 229.23 | 94.772 | 41.34% |
| Katarungan | 662.961 | 93.518 | 14.11% |
| Pangpang | 802.227 | 537.255 | 66.97% |
| Poblacion | 146.363 | 49.272 | 33.66% |
| San Isidro | 196.71 | 138.03 | 70.17% |
| Sentinila | 223.647 | 92.656 | 41.43% |
| Sinandigan | 618.453 | 81.682 | 13.21% |
| Tapal | 204.493 | 17.917 | 8.76% |
| Tapon | 48.963 | 48.761 | 99.59% |
| Tintinan | 101.455 | 15.965 | 15.74% |
| Tipolo | 530.348 | 58.275 | 10.99% |
| Union | 402.419 | 20.199 | 5.02% |
| Total | 25,218.06 | 2,299.22 | 728.48% |