
Download in PDF and JPG format
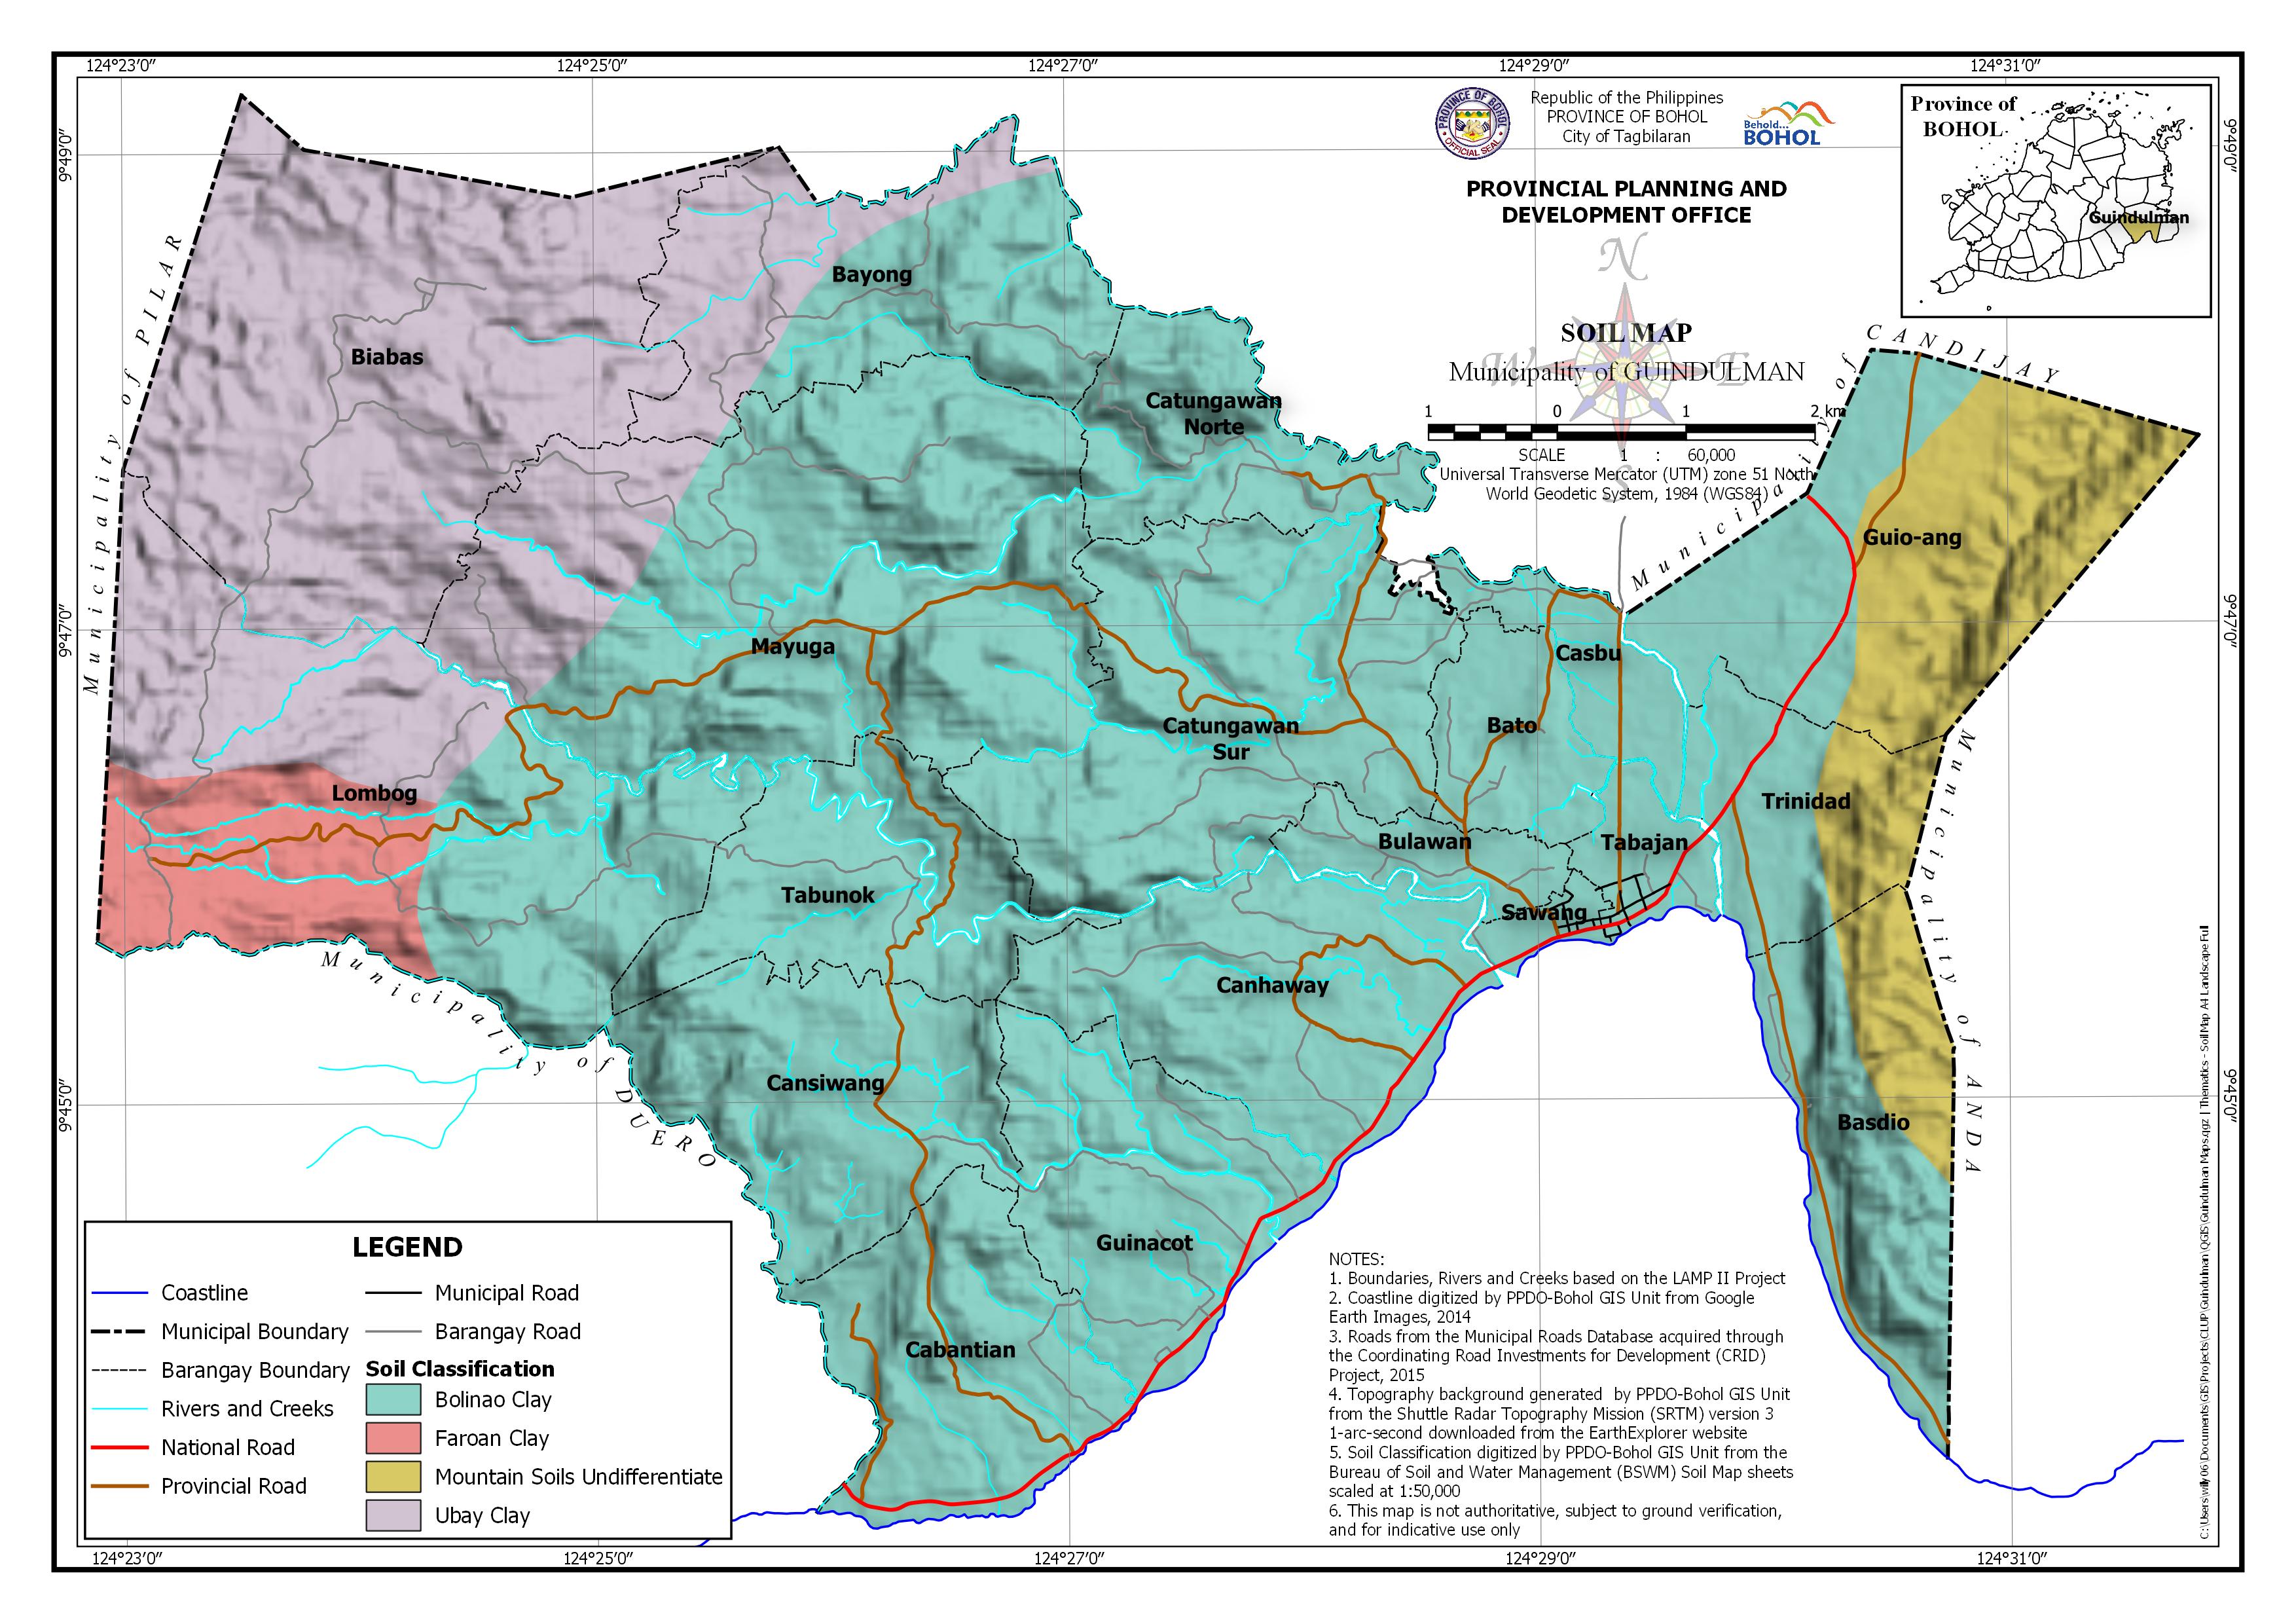
AREA PER SOIL CLASSIFICATION BY BARANGAY
| Barangay | Area | Bolinao Clay | Faroan Clay | Mountain Soils Undifferentiate | Ubay Clay | ||||
| Hectares | Hectares | Percentage | Hectares | Percentage | Hectares | Percentage | Hectares | Percentage | |
| Basdio | 423.159 | 297.809 | 70.38% | 125.35 | 29.62% | ||||
| Bato | 180.858 | 180.858 | 100.00% | ||||||
| Bayong | 575.094 | 313.067 | 54.44% | 262.027 | 45.56% | ||||
| Biabas | 1,151.05 | 1,151.05 | 100.00% | ||||||
| Bulawan | 118.372 | 118.372 | 100.00% | ||||||
| Cabantian | 438.102 | 438.102 | 100.00% | ||||||
| Canhaway | 527.07 | 527.07 | 100.00% | ||||||
| Cansiwang | 485.754 | 485.754 | 100.00% | ||||||
| Casbu | 132.375 | 132.375 | 100.00% | ||||||
| Catungawan Norte | 292.09 | 292.09 | 100.00% | ||||||
| Catungawan Sur | 751.384 | 751.384 | 100.00% | ||||||
| Guinacot | 438.701 | 438.701 | 100.00% | ||||||
| Guio-ang | 716.046 | 287.656 | 40.17% | 428.39 | 59.83% | ||||
| Lombog | 1,119.95 | 401.605 | 35.86% | 330.79 | 29.54% | 387.558 | 34.61% | ||
| Mayuga | 1,266.42 | 1,015.08 | 80.15% | 251.338 | 19.85% | ||||
| Sawang | 40.313 | 40.313 | 100.00% | ||||||
| Tabajan | 94.106 | 94.106 | 100.00% | ||||||
| Tabunok | 398.162 | 398.162 | 100.00% | ||||||
| Trinidad | 277.31 | 174.954 | 63.09% | 102.356 | 36.91% | ||||
| TOTAL | 9,426.31 | 6,387.46 | 67.76% | 330.79 | 3.51% | 656.096 | 6.96% | 2,051.97 | 21.77% |