
Download in PDF and JPG format
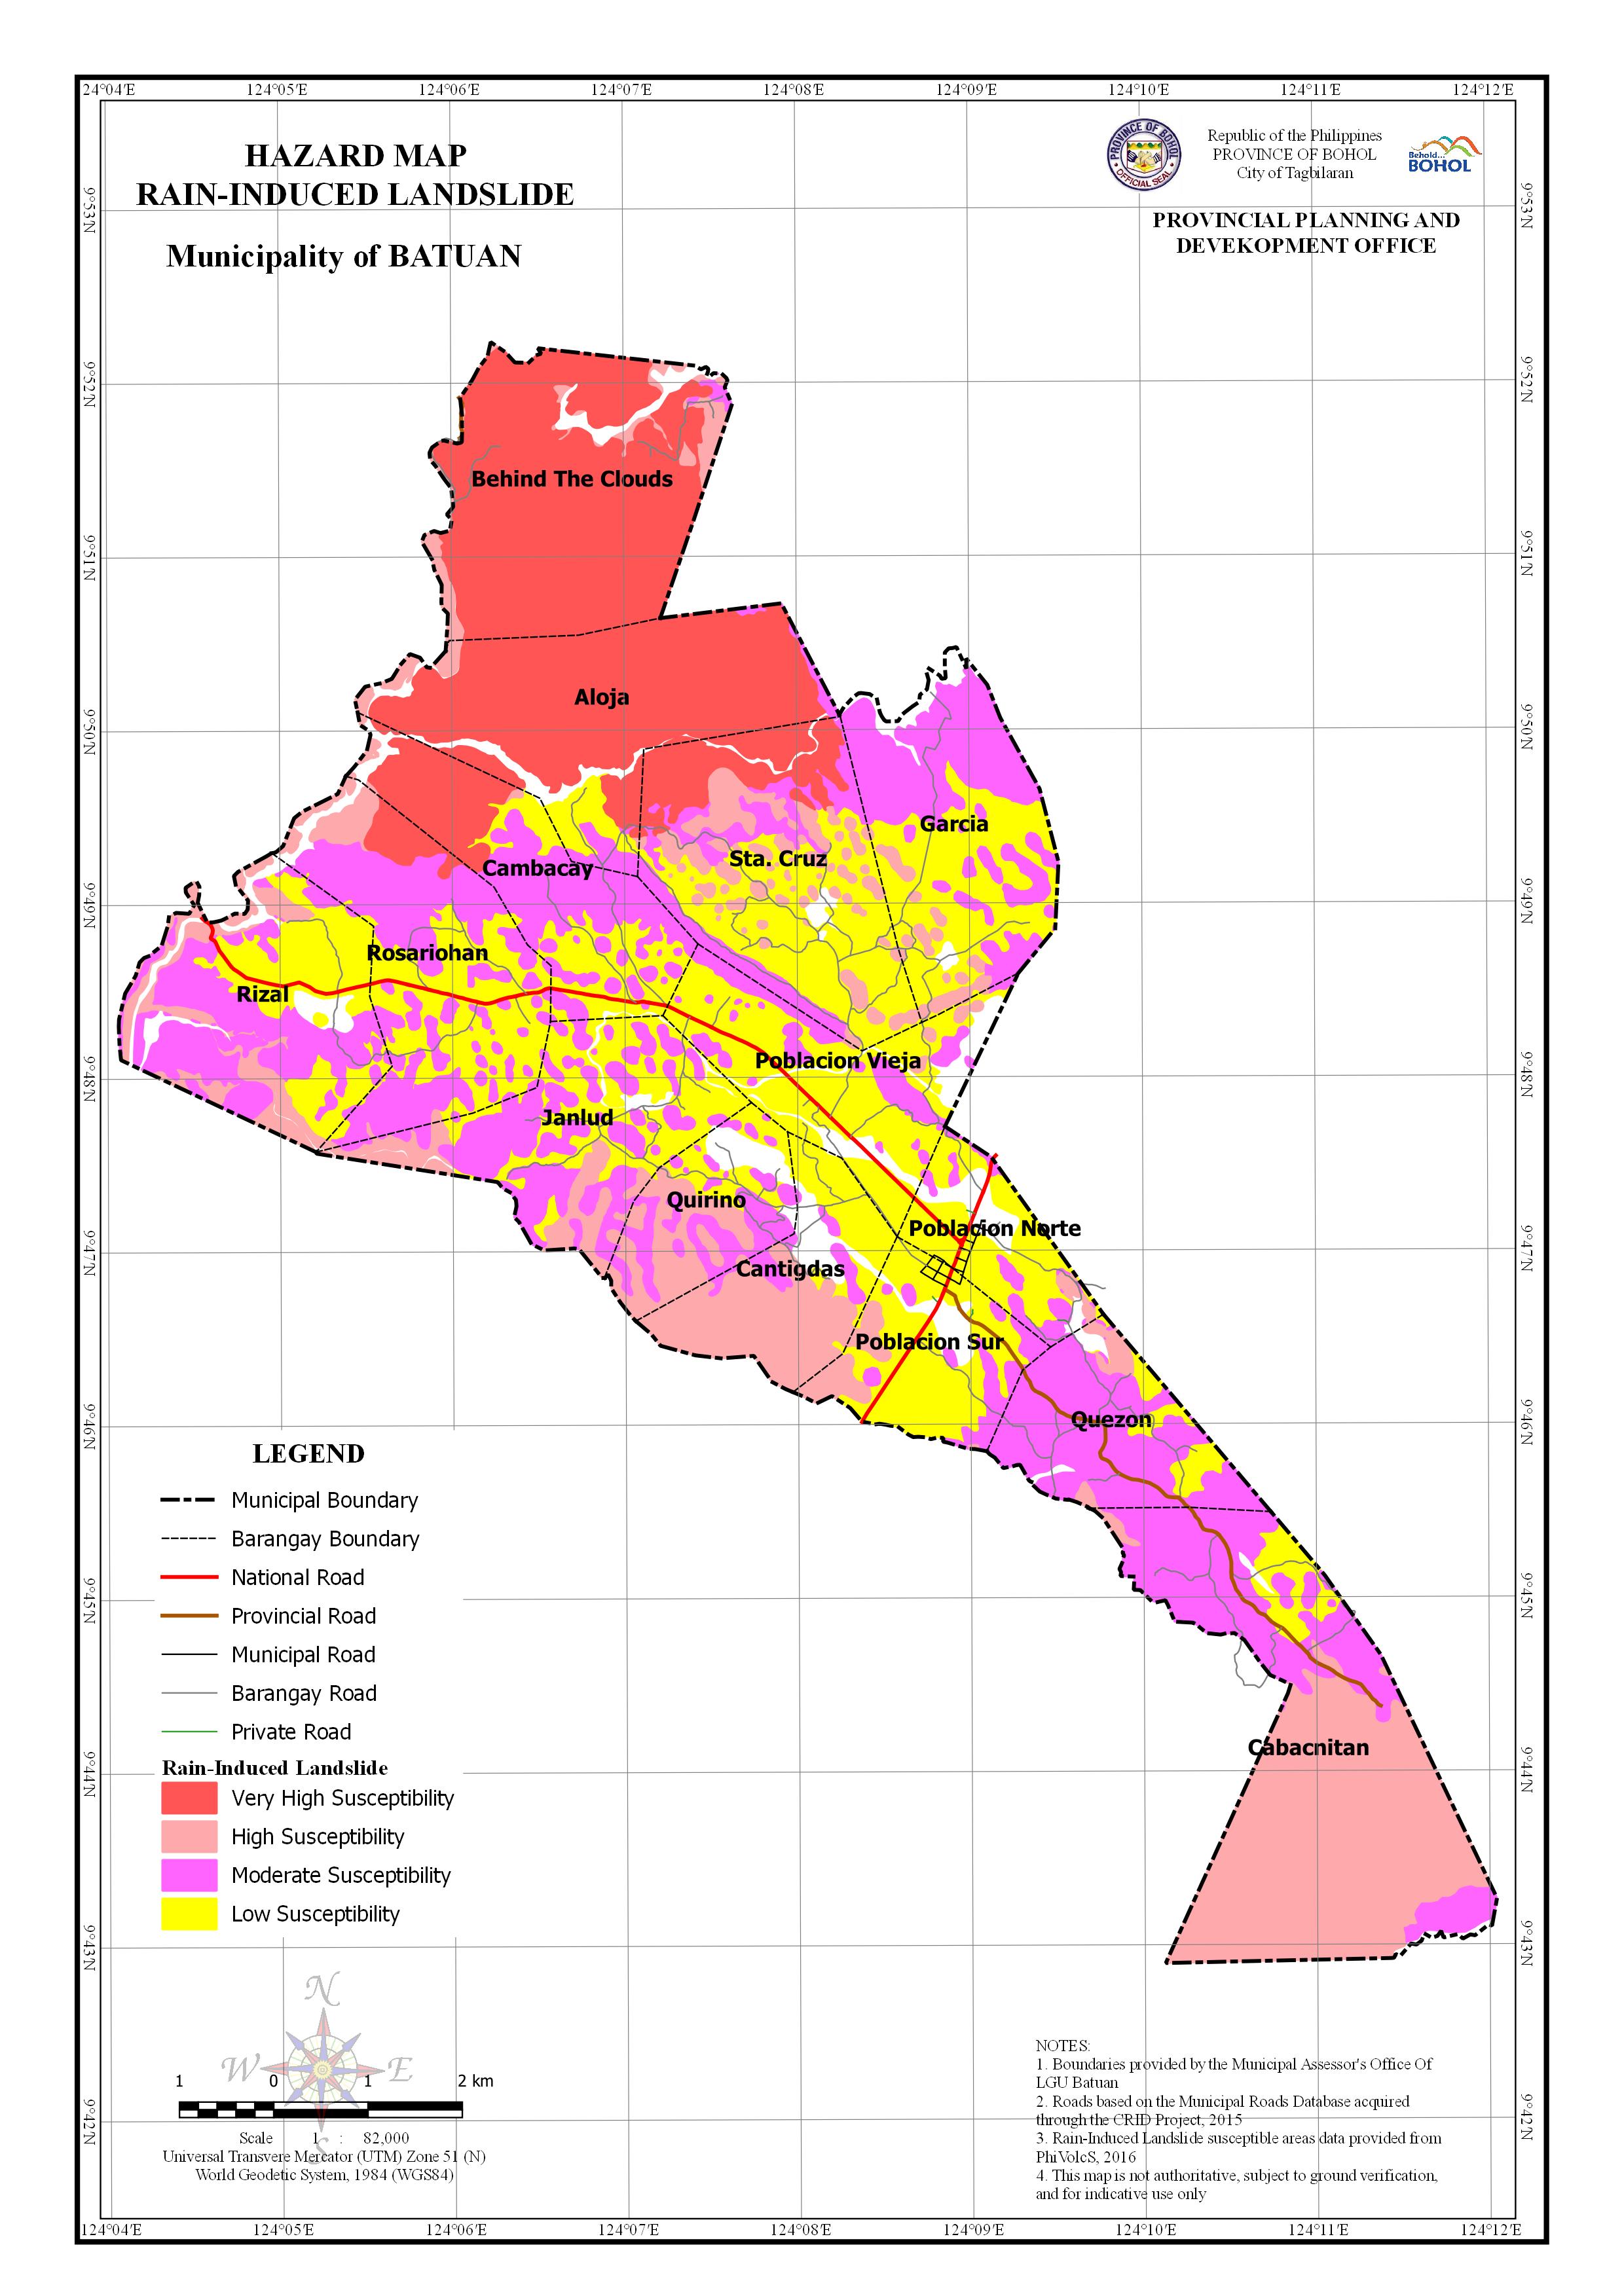
AREA EXPOSED TO RAIN-INDUCED LANDSLIDE HAZARD BY BARANGAY
| Barangay | Area | Area Exposed to Very High Susceptibility | Area Exposed to High Susceptibility | Area Exposed to Moderate Susceptibility | Area Exposed to Low Susceptibility | ||||
| (Hectares) | (Hectares) | Percentage | (Hectares) | Percentage | (Hectares) | Percentage | (Hectares) | Percentage | |
| Aloja | 703.38 | 572.236 | 81.355% | 17.061 | 2.426% | 30.432 | 4.327% | 40.068 | 5.697% |
| Behind The Clouds | 777.08 | 677.132 | 87.138% | 62.733 | 8.073% | 4.825 | 0.621% | 0 | 0.000% |
| Cabacnitan | 1009.193 | 651.562 | 64.563% | 291.966 | 28.931% | 54.714 | 5.422% | ||
| Cambacay | 434.135 | 112.13 | 25.828% | 6.257 | 1.441% | 169.09 | 38.949% | 129.699 | 29.875% |
| Cantigdas | 326.134 | 185.546 | 56.892% | 23.026 | 7.060% | 80.138 | 24.572% | ||
| Garcia | 565.007 | 28.962 | 5.126% | 247.636 | 43.829% | 253.814 | 44.922% | ||
| Janlud | 506.905 | 82.985 | 16.371% | 197.263 | 38.915% | 201.459 | 39.743% | ||
| Poblacion Norte | 224.341 | 7.788 | 3.471% | 27.804 | 12.393% | 144.448 | 64.388% | ||
| Poblacion Sur | 317.725 | 37.264 | 11.728% | 42.77 | 13.461% | 207.47 | 65.299% | ||
| Poblacion Vieja | 447.363 | 7.652 | 1.711% | 74.773 | 16.714% | 295.224 | 65.992% | ||
| Quezon | 344.134 | 20.9 | 6.073% | 267.414 | 77.706% | 45.207 | 13.136% | ||
| Quirino | 269.747 | 108.035 | 40.050% | 76.612 | 28.401% | 50.159 | 18.595% | ||
| Rizal | 583.21 | 114.083 | 19.561% | 214.604 | 36.797% | 192.259 | 32.966% | ||
| Rosariohan | 588.702 | 33.623 | 5.711% | 40.557 | 6.889% | 258.817 | 43.964% | 240.121 | 40.788% |
| Sta. Cruz | 676.062 | 124.572 | 18.426% | 127.143 | 18.806% | 106.084 | 15.691% | 296.923 | 43.920% |
| Total | 7773.119 | 1519.693 | 19.551% | 1498.526 | 19.278% | 2033.116 | 26.156% | 2231.704 | 28.711% |