
Download in PDF and JPG format
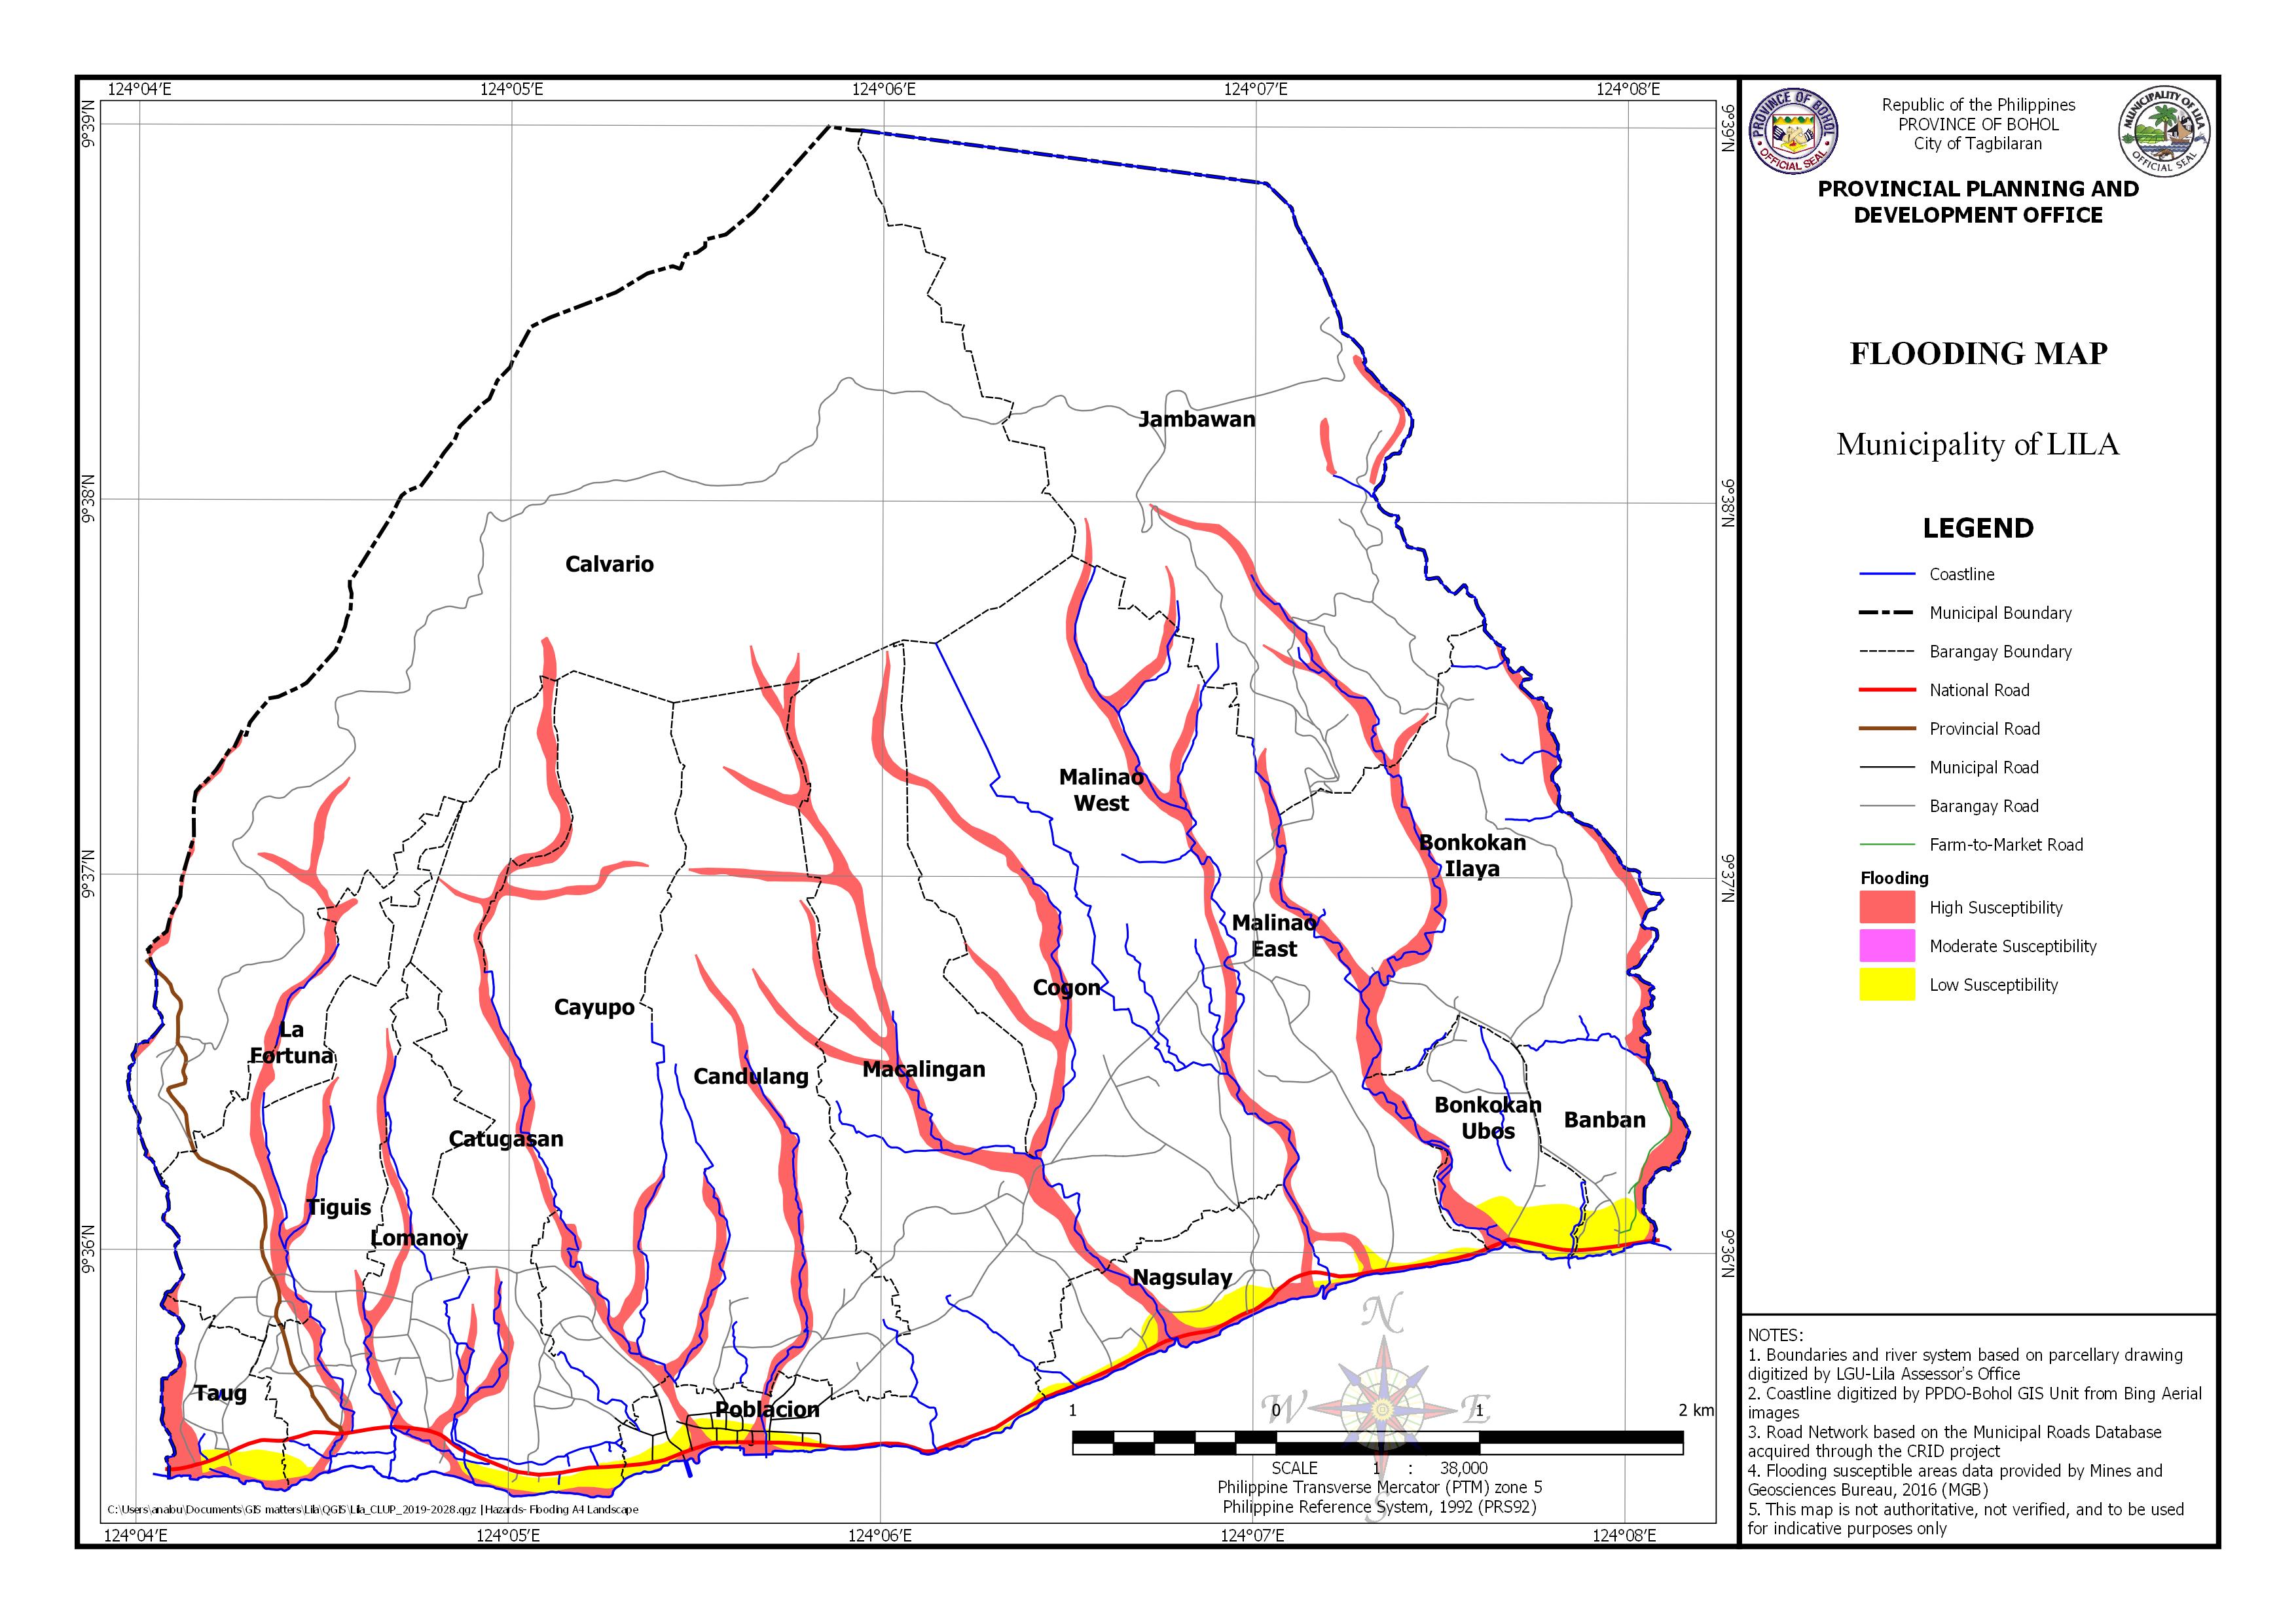
AREA EXPOSED TO FLOODING BY BARANGAY
| Barangay | Area | Area Exposed to High Susceptibility | Area Exposed to Low Susceptibility | Area Exposed to Moderate Susceptibility | |||
|---|---|---|---|---|---|---|---|
| (Hectares) | (Hectares) | Percentage | (Hectares) | Percentage | (Hectares) | Percentage | |
| Banban | 54.651 | 5.048 | 9.238% | 7.357 | 13.462% | 0.033 | 0.060% |
| Bonkokan Ilaya | 235.481 | 21.943 | 9.319% | ||||
| Bonkokan Ubos | 66.327 | 6.959 | 10.493% | 9.584 | 14.450% | ||
| Calvario | 806.148 | 9.702 | 1.203% | ||||
| Candulang | 293.490 | 24.243 | 8.260% | ||||
| Catugasan | 171.121 | 15.792 | 9.228% | 6.285 | 3.673% | ||
| Cayupo | 217.302 | 13.220 | 6.083% | ||||
| Cogon | 207.025 | 16.007 | 7.732% | ||||
| Jambawan | 499.561 | 12.529 | 2.508% | ||||
| La Fortuna | 90.095 | 8.055 | 8.941% | ||||
| Lomanoy | 85.477 | 9.172 | 10.731% | 0.222 | 0.259% | ||
| Macalingan | 283.497 | 23.363 | 8.241% | 0.534 | 0.188% | ||
| Malinao East | 194.783 | 18.214 | 9.351% | 2.879 | 1.478% | ||
| Malinao West | 150.937 | 9.562 | 6.335% | ||||
| Nagsulay | 70.907 | 9.473 | 13.360% | 8.324 | 11.740% | ||
| Poblacion | 47.646 | 4.861 | 10.203% | 8.263 | 17.343% | ||
| Taug | 39.564 | 8.189 | 20.699% | 4.761 | 12.034% | ||
| Tiguis | 119.020 | 9.397 | 7.895% | 1.117 | 0.939% | ||
| Total | 3633.033 | 225.729 | 159.819% | 49.326 | 75.566% | 0.033 | 0.060% |