
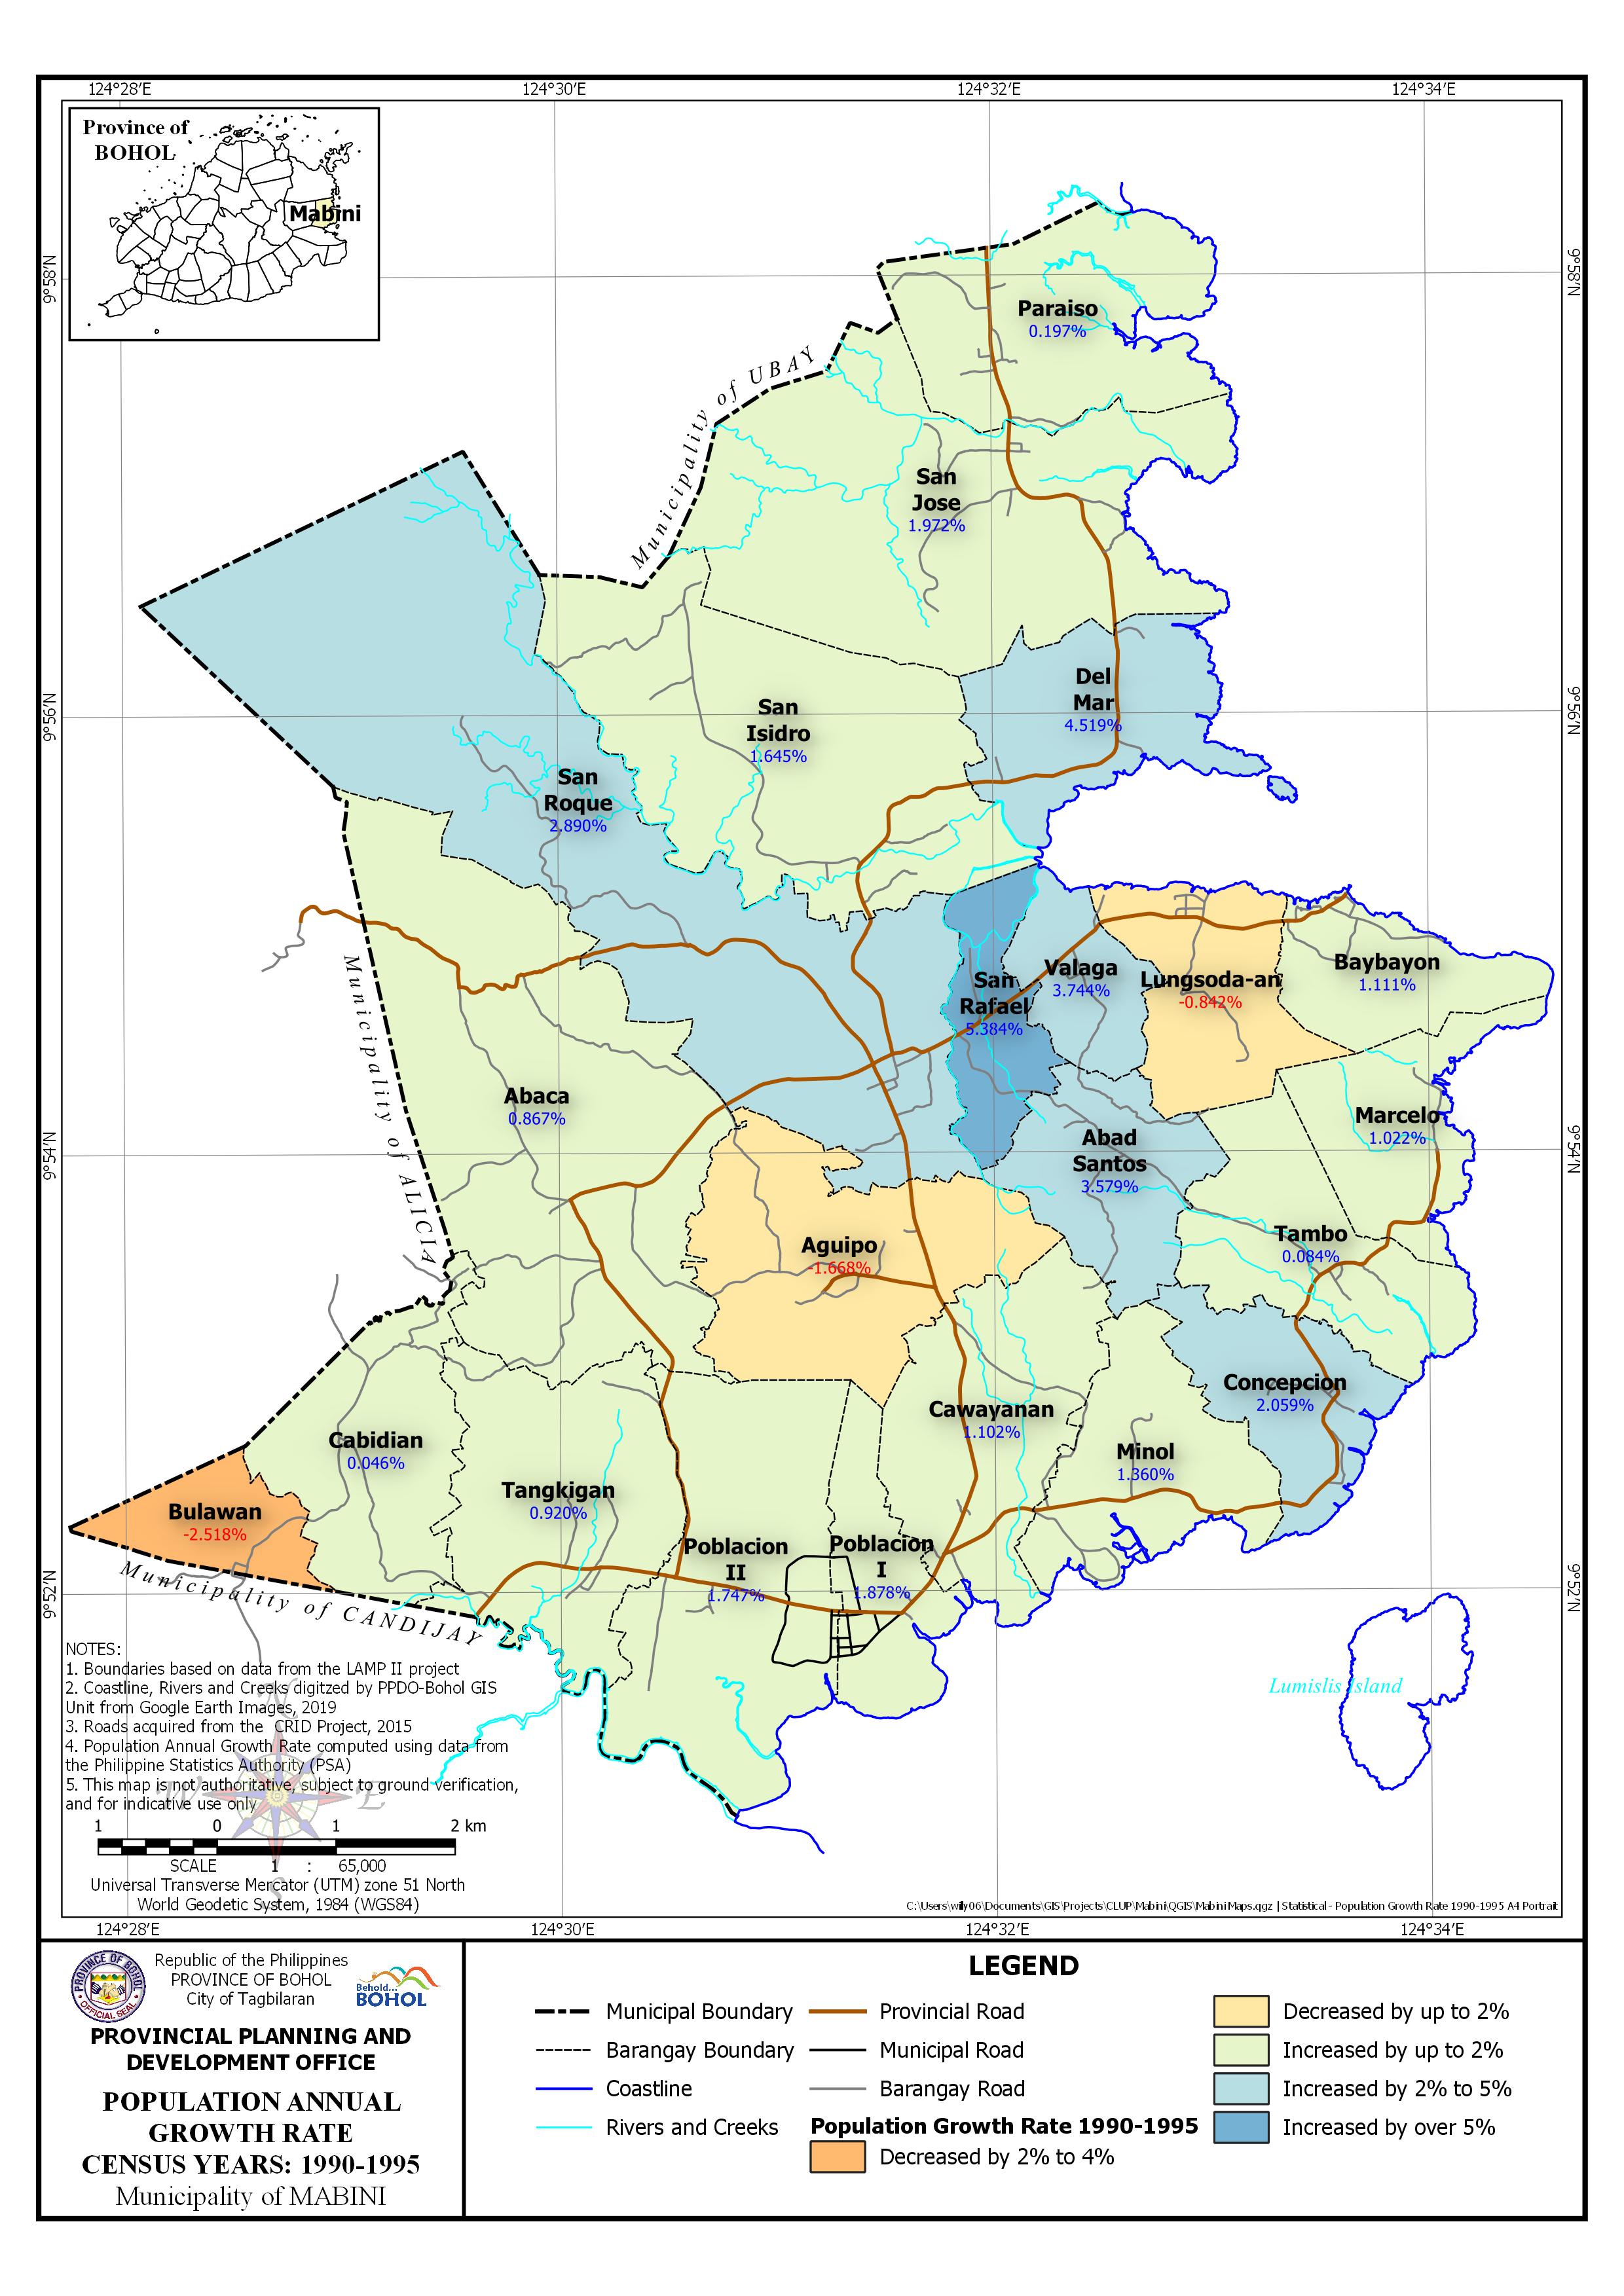
 | Annual Growth Rate Census Year: 1990-1995 Download in PDF and JPG format |
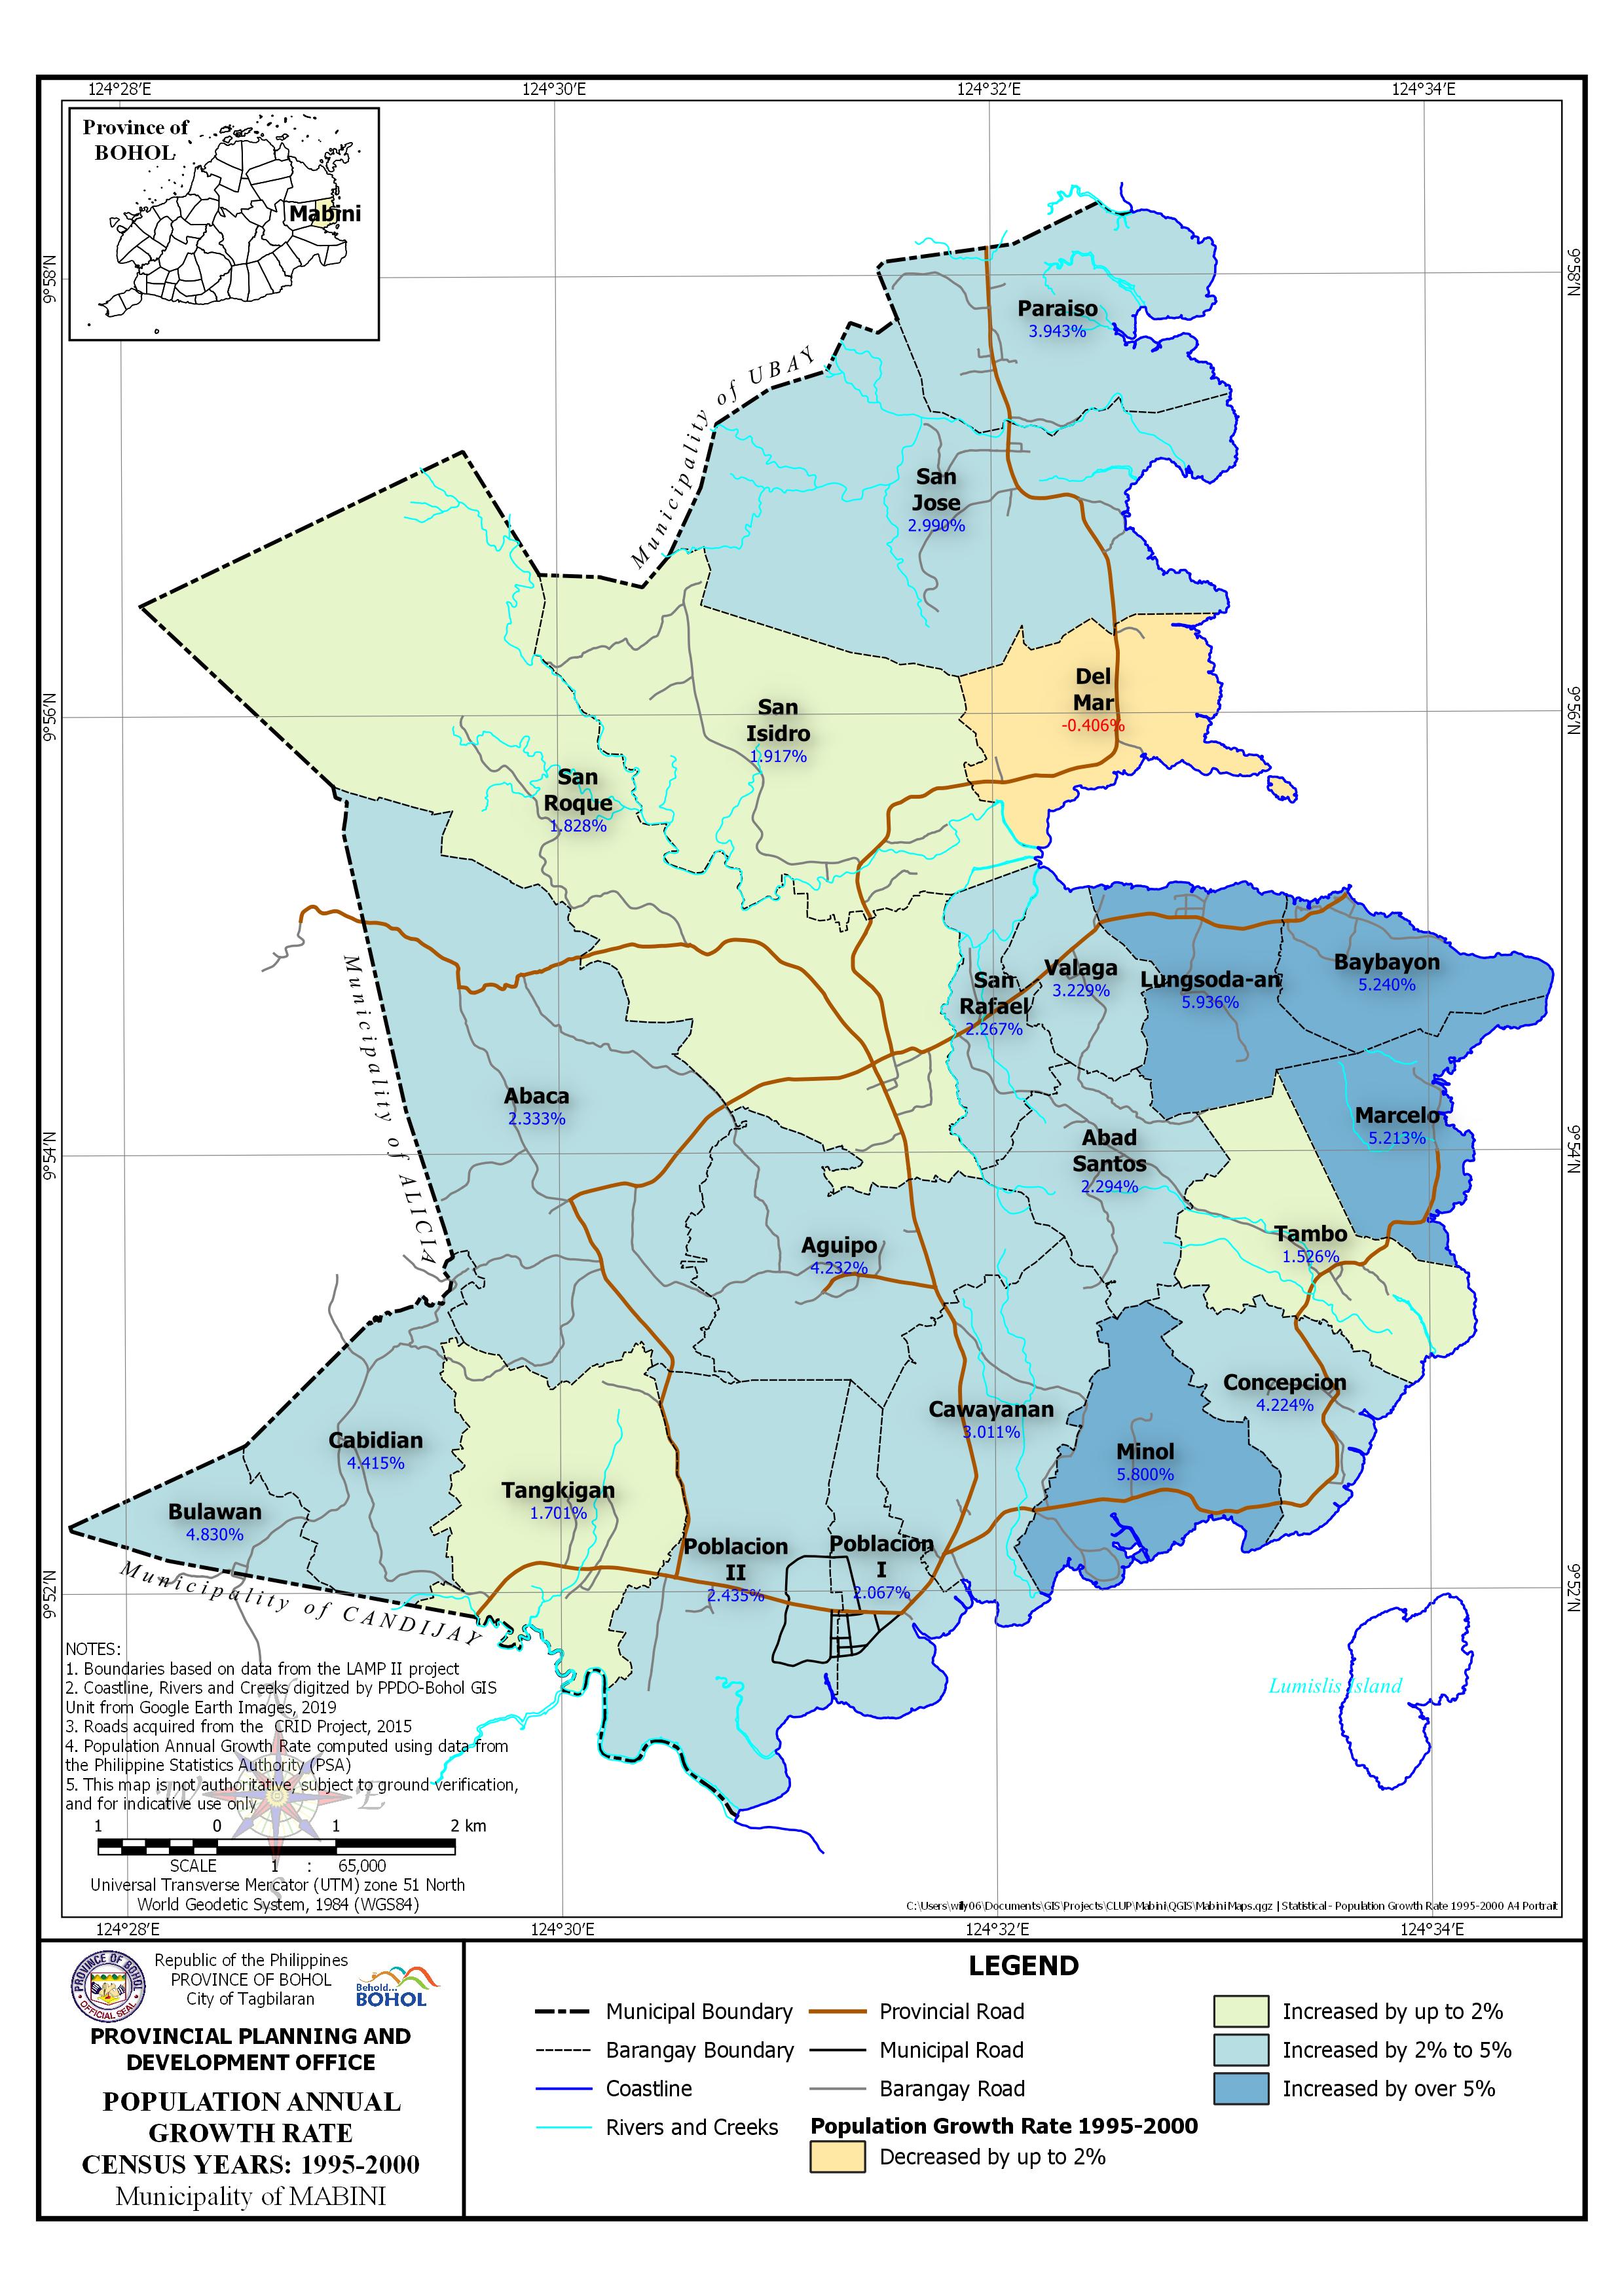 | Annual Growth Rate Census Year: 1995-2000 Download in PDF and JPG format |
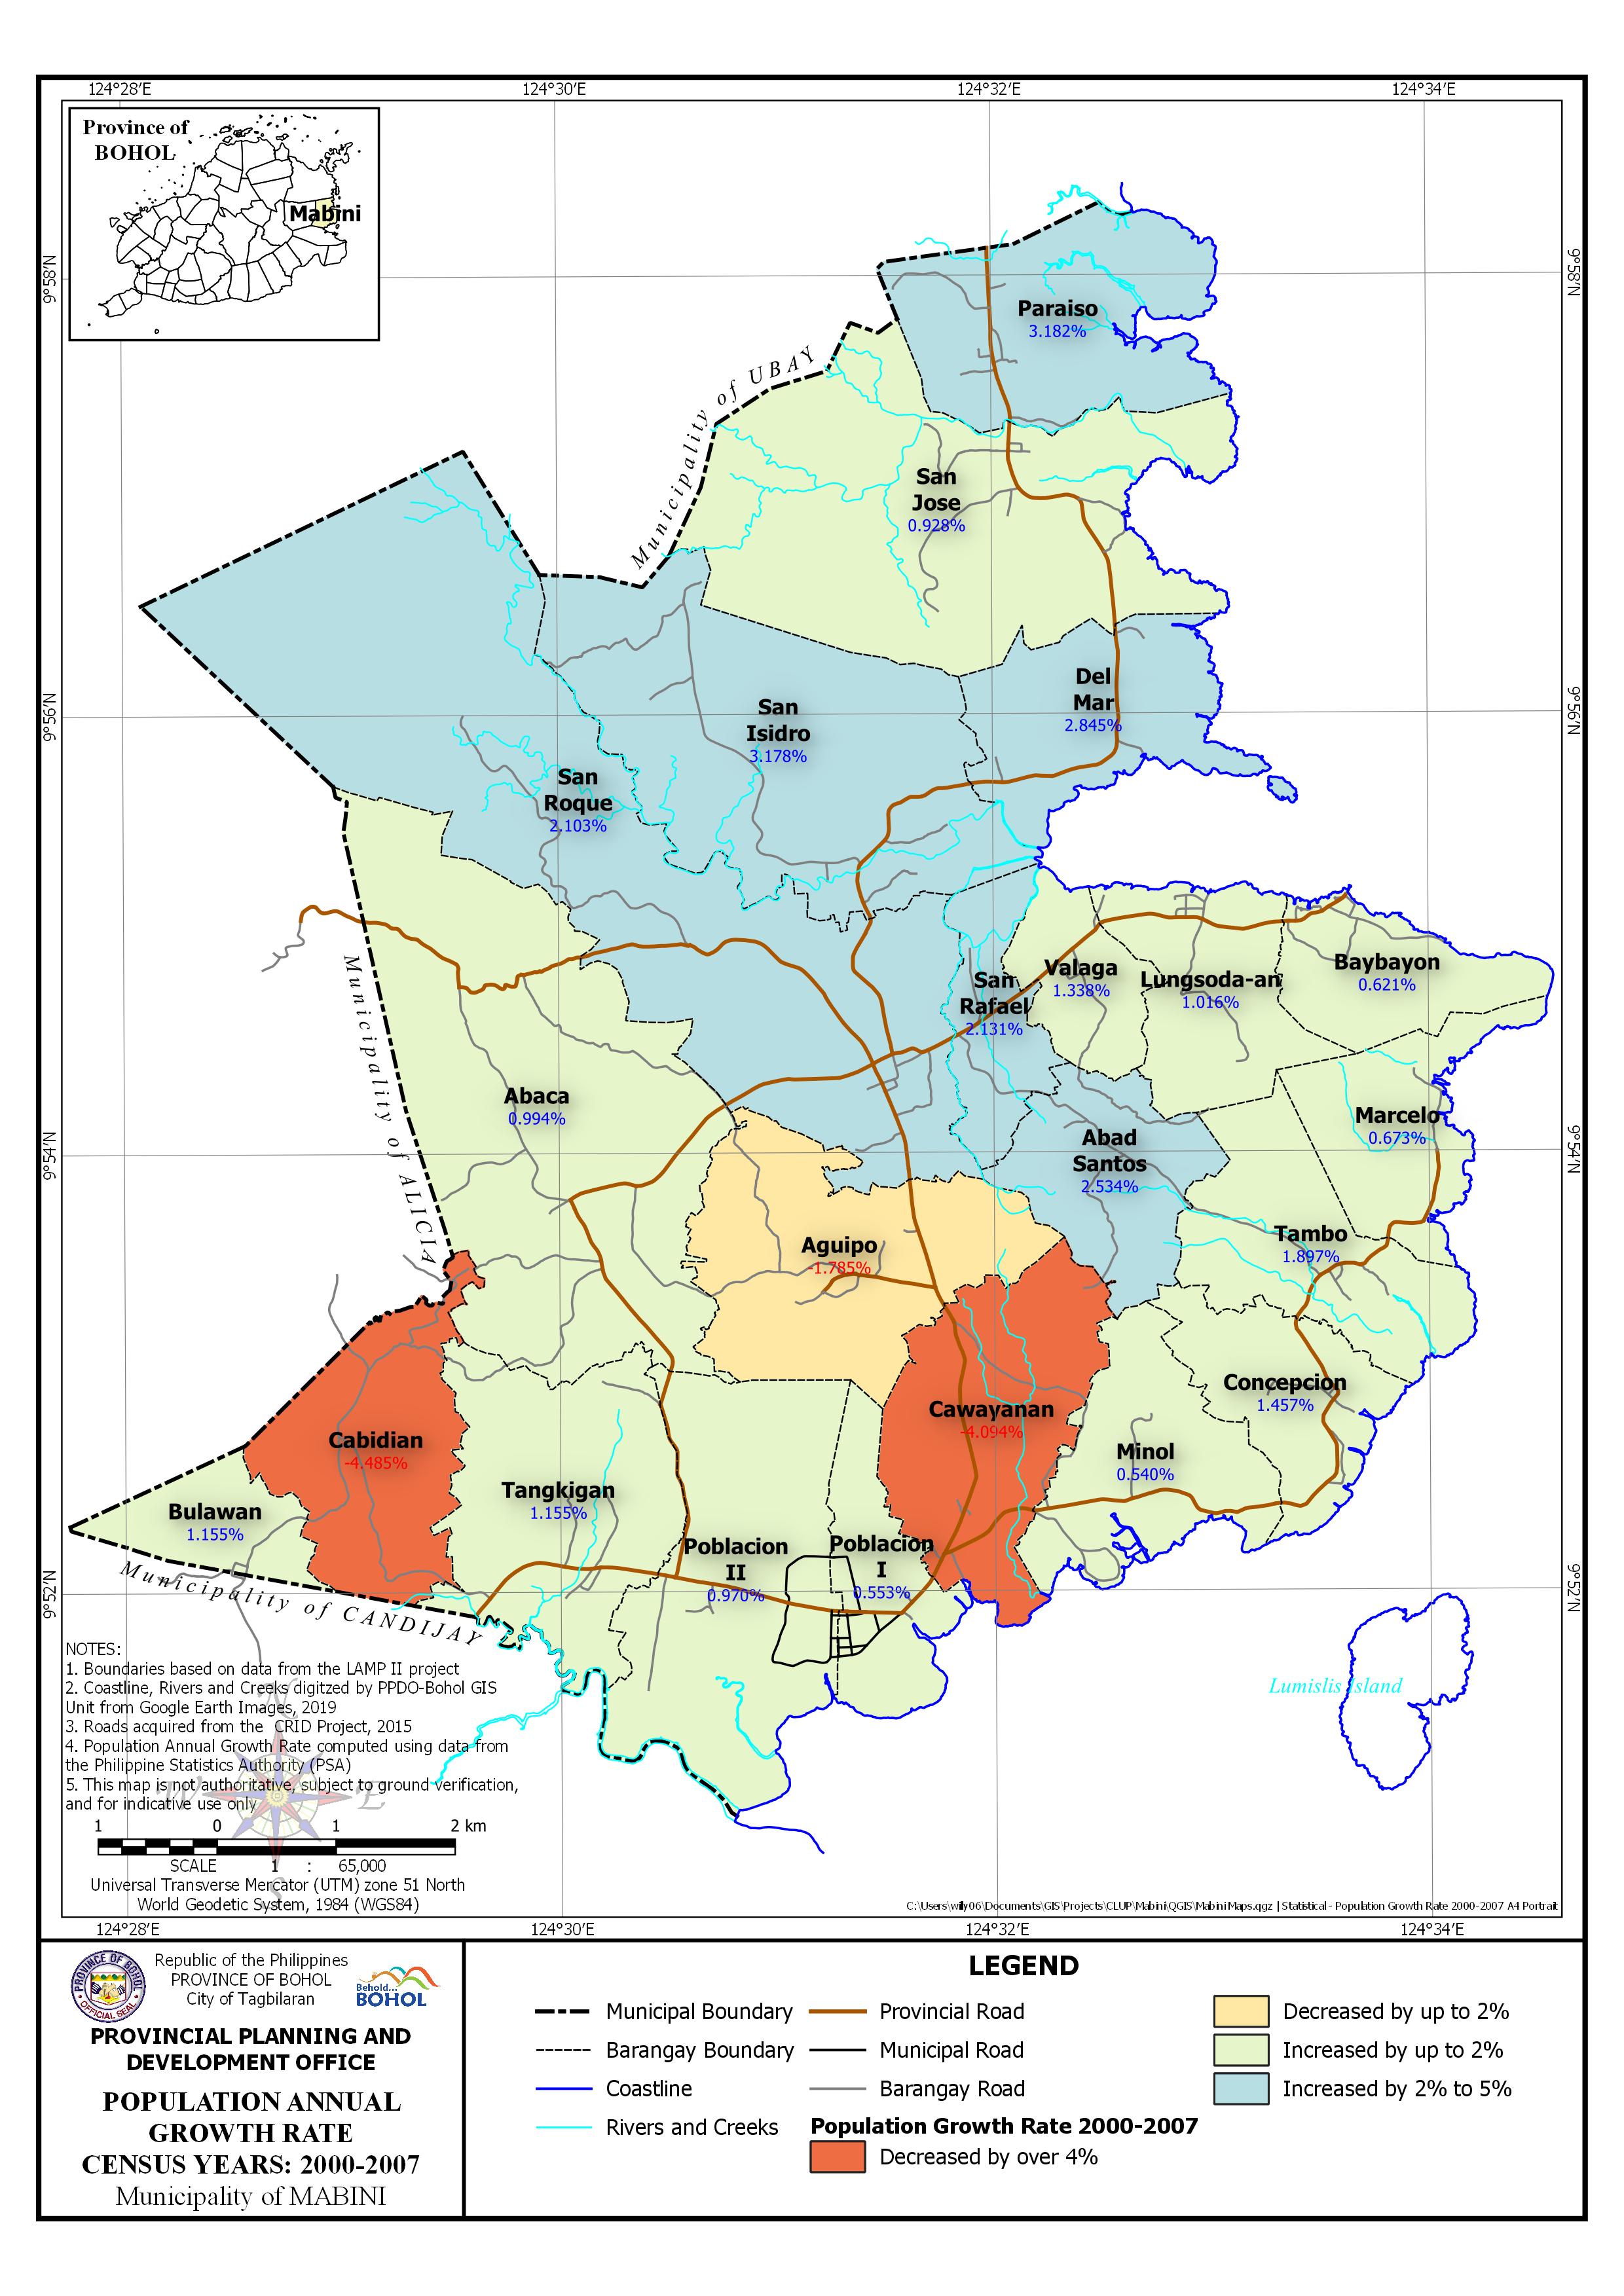 | Annual Growth Rate Census Year: 2000-2007 Download in PDF and JPG format |
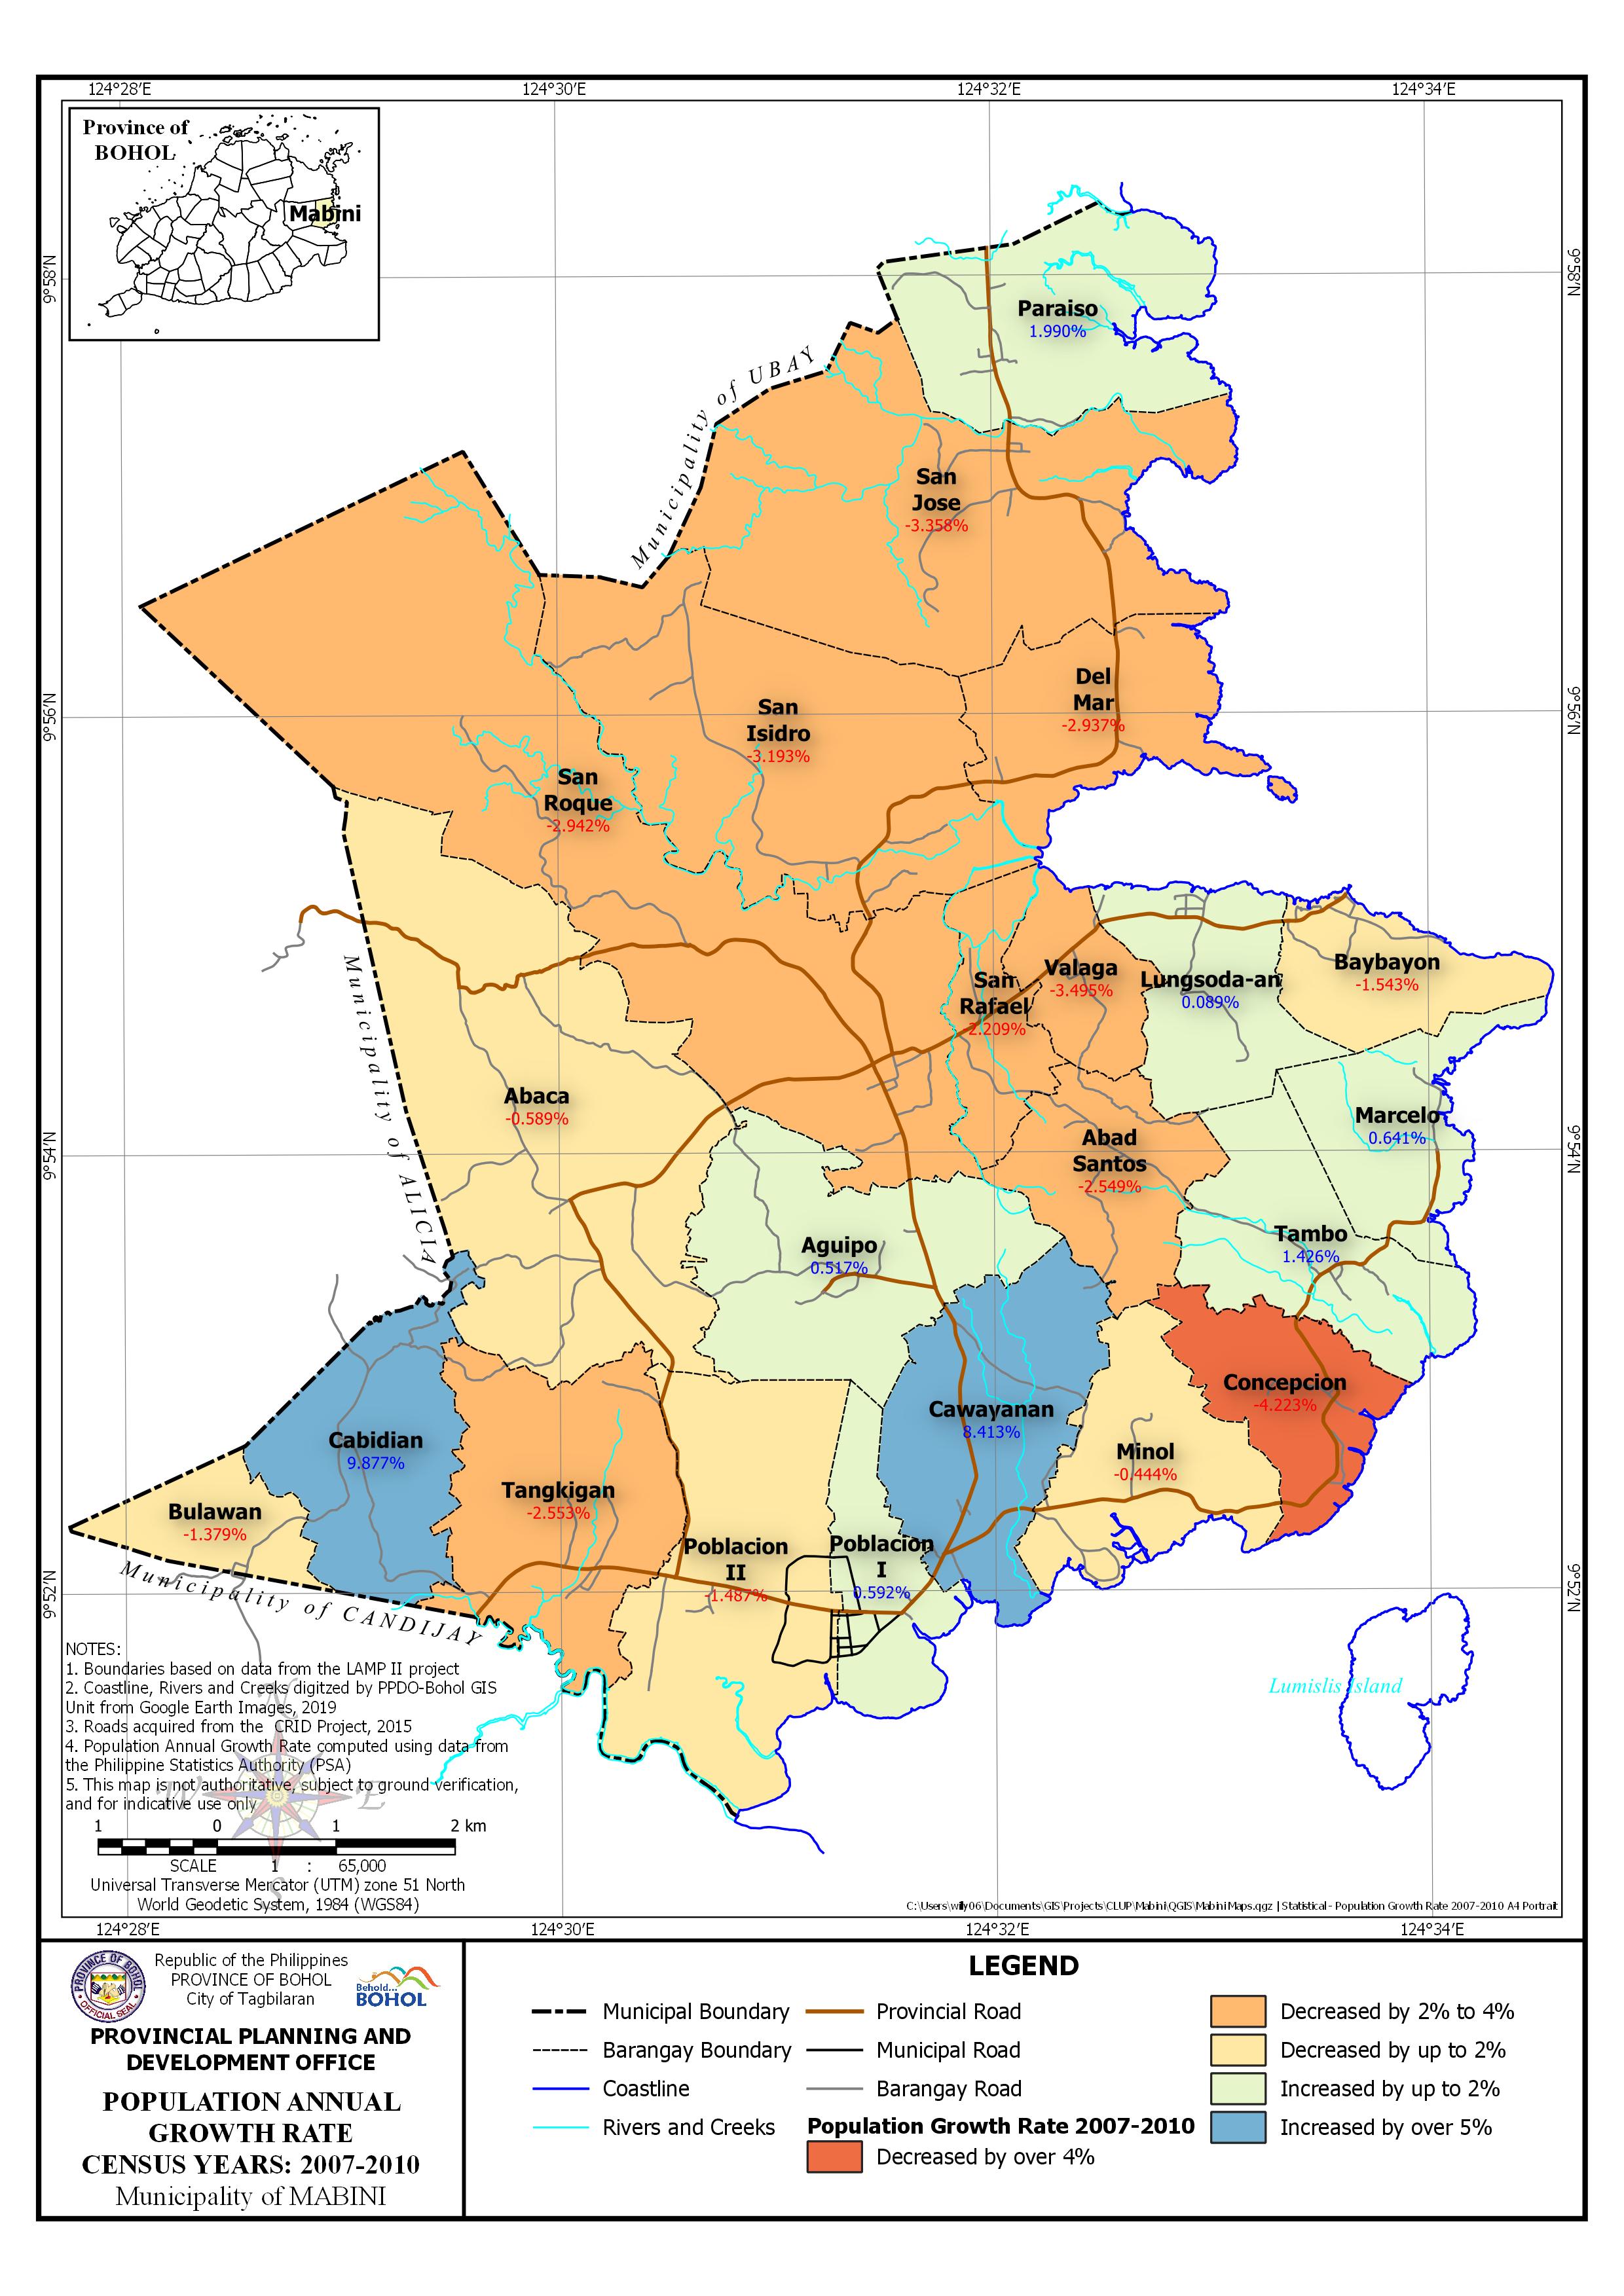 | Annual Growth Rate Census Year: 2007-2010 Download in PDF and JPG format |
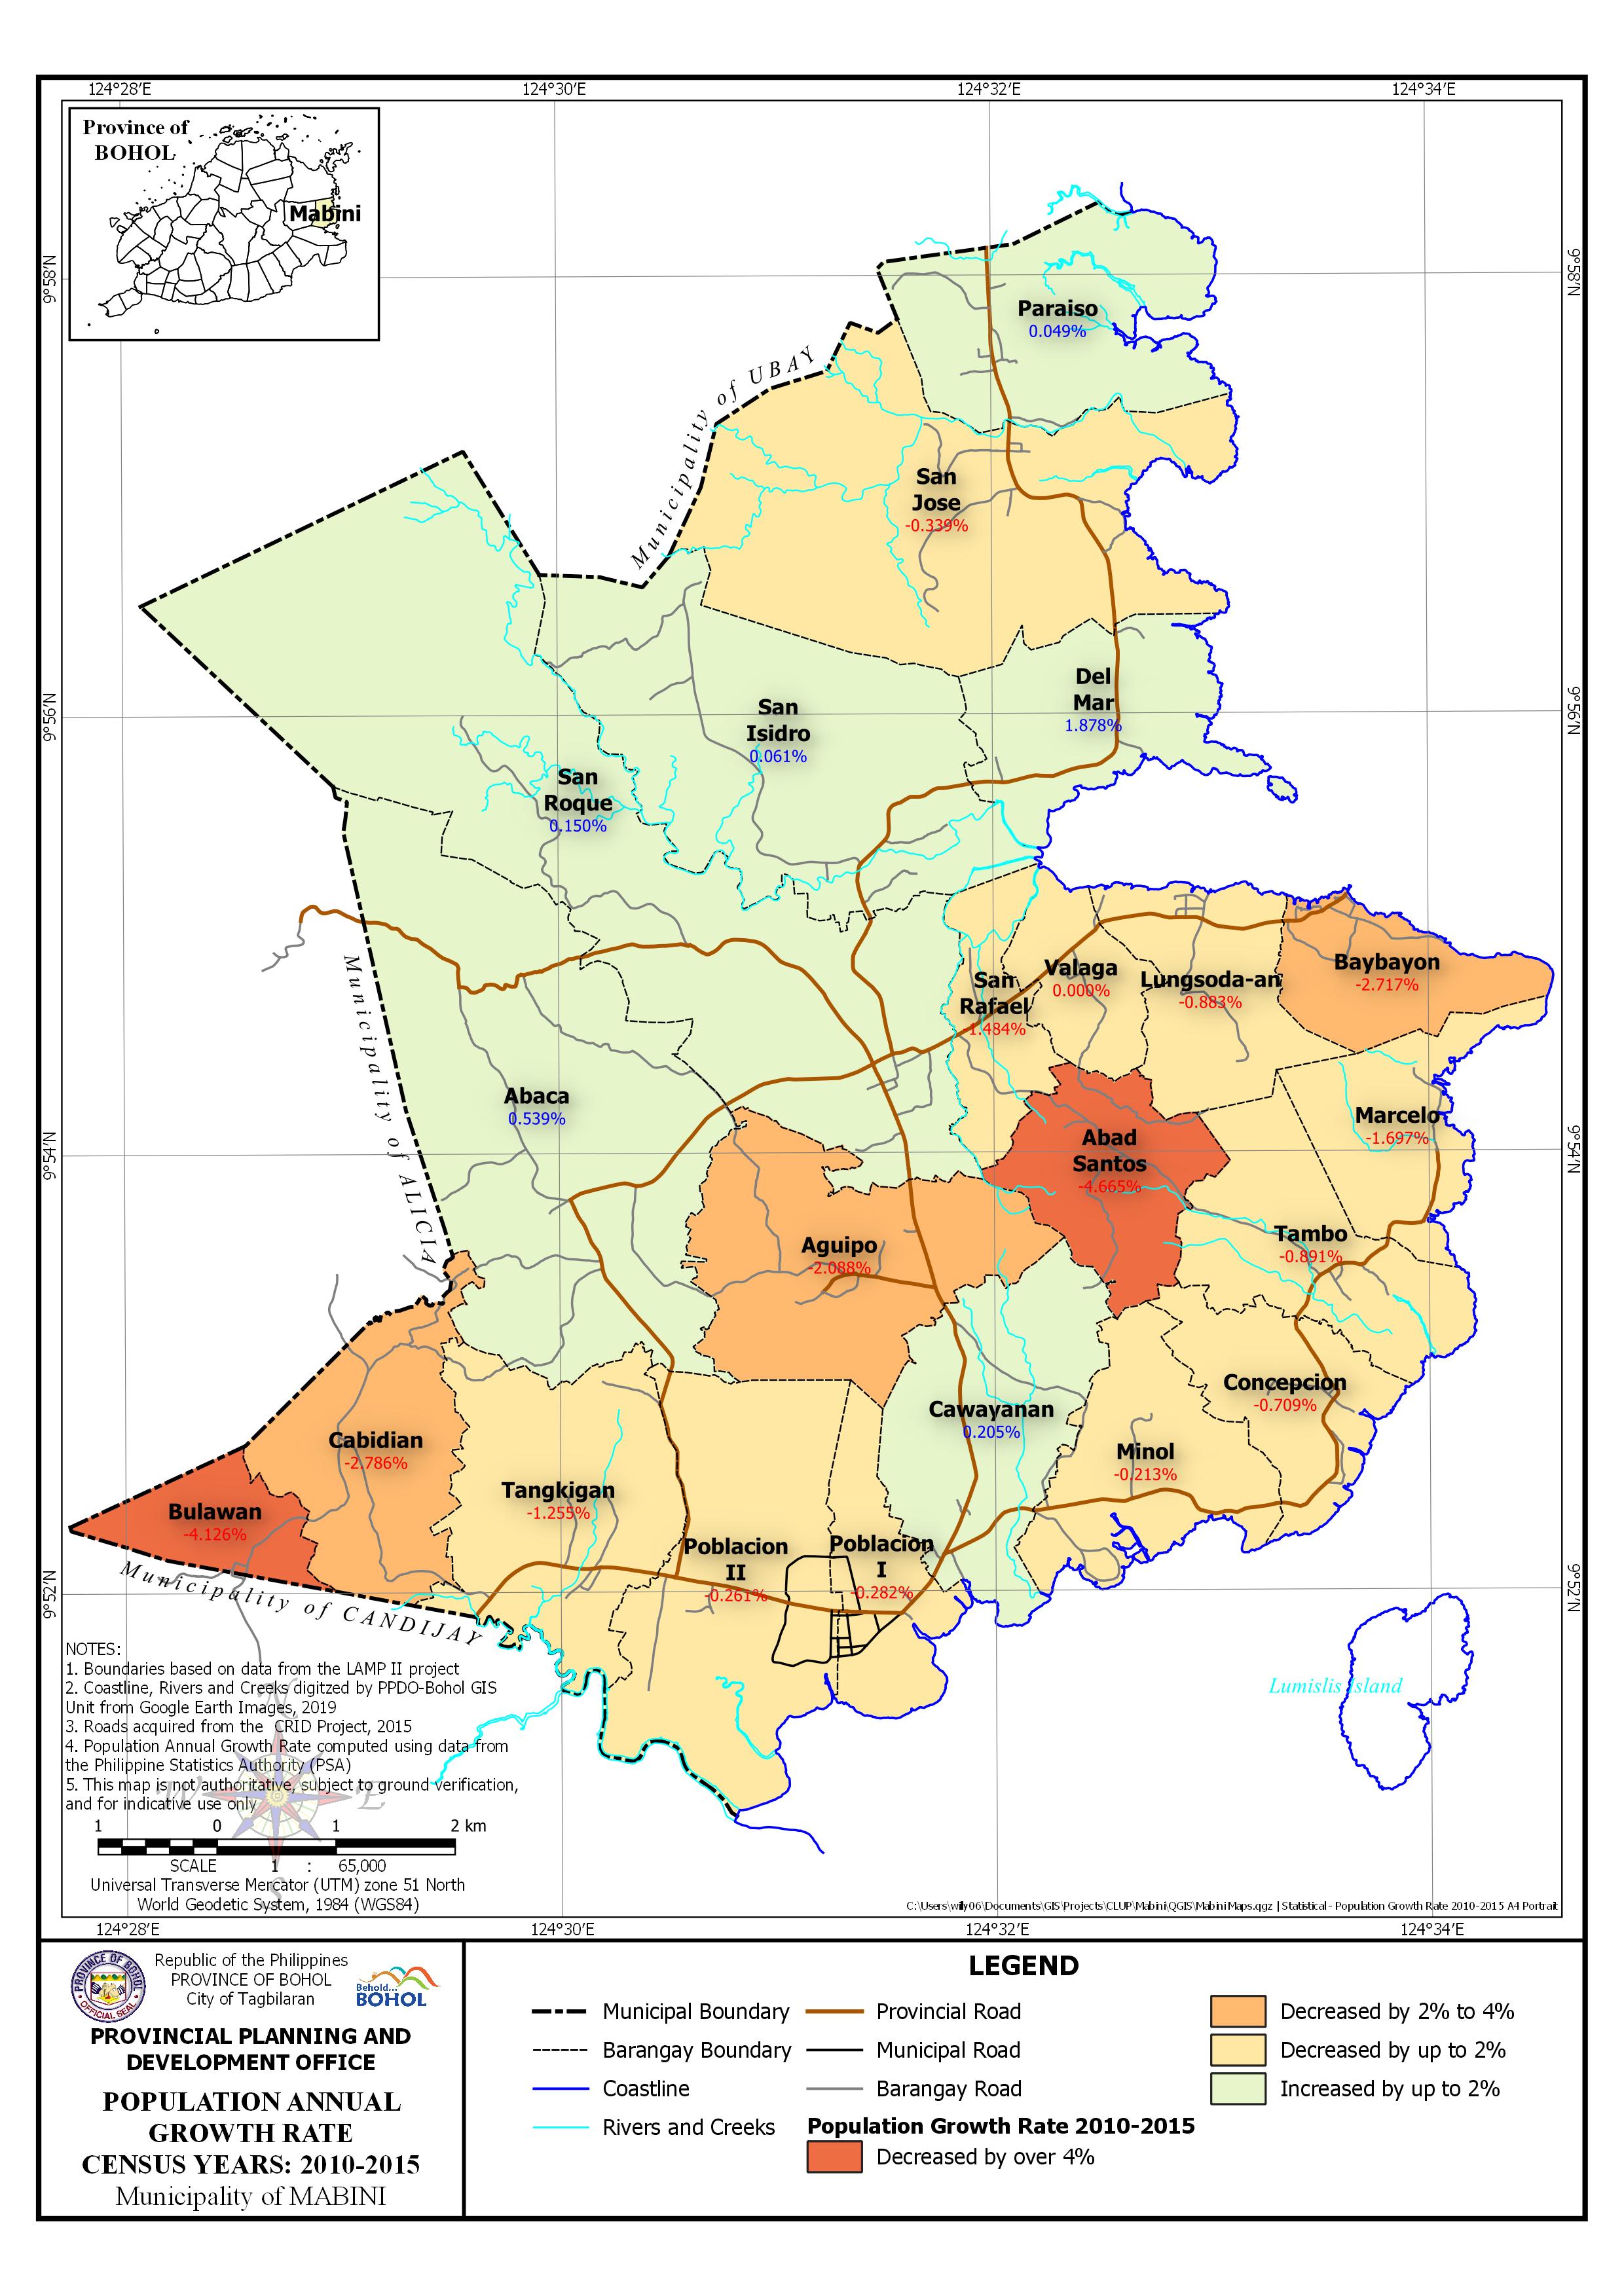 | Annual Growth Rate Census Year: 2010-2015 Download in PDF and JPG format |
| Barangay | Census Years | ||||
| 1990 – 1995 | 1995 – 2000 | 2000 – 2007 | 2007 – 2010 | 2010 – 2015 | |
| Abaca | 0.87% | 2.33% | 0.99% | -0.59% | 0.54% |
| Abad Santos | 3.58% | 2.29% | 2.53% | -2.55% | -4.67% |
| Aguipo | -1.67% | 4.23% | -1.79% | 0.52% | -2.09% |
| Baybayon | 1.11% | 5.24% | 0.62% | -1.54% | -2.72% |
| Bulawan | -2.52% | 4.83% | 1.16% | -1.38% | -4.13% |
| Cabidian | 0.05% | 4.42% | -4.49% | 9.88% | -2.79% |
| Cawayanan | 1.10% | 3.01% | -4.09% | 8.41% | 0.21% |
| Concepcion | 2.06% | 4.22% | 1.46% | -4.22% | -0.71% |
| Del Mar | 4.52% | -0.41% | 2.85% | -2.94% | 1.88% |
| Lungsoda-an | -0.84% | 5.94% | 1.02% | 0.09% | -0.88% |
| Marcelo | 1.02% | 5.21% | 0.67% | 0.64% | -1.70% |
| Minol | 1.36% | 5.80% | 0.54% | -0.44% | -0.21% |
| Paraiso | 0.20% | 3.94% | 3.18% | 1.99% | 0.05% |
| Poblacion I | 1.88% | 2.07% | 0.55% | 0.59% | -0.28% |
| Poblacion II | 1.75% | 2.44% | 0.97% | -1.49% | -0.26% |
| San Isidro | 1.65% | 1.92% | 3.18% | -3.19% | 0.06% |
| San Jose | 1.97% | 2.99% | 0.93% | -3.36% | -0.34% |
| San Rafael | 5.38% | 2.27% | 2.13% | -2.21% | -1.48% |
| San Roque | 2.89% | 1.83% | 2.10% | -2.94% | 0.15% |
| Tambo | 0.08% | 1.53% | 1.90% | 1.43% | -0.89% |
| Tangkigan | 0.92% | 1.70% | 1.16% | -2.55% | -1.26% |
| Valaga | 3.74% | 3.23% | 1.34% | -3.50% | |
| MUNICIPAL | 1.35% | 3.12% | 0.79% | -0.72% | -0.72% |