
Download in PDF and JPG format
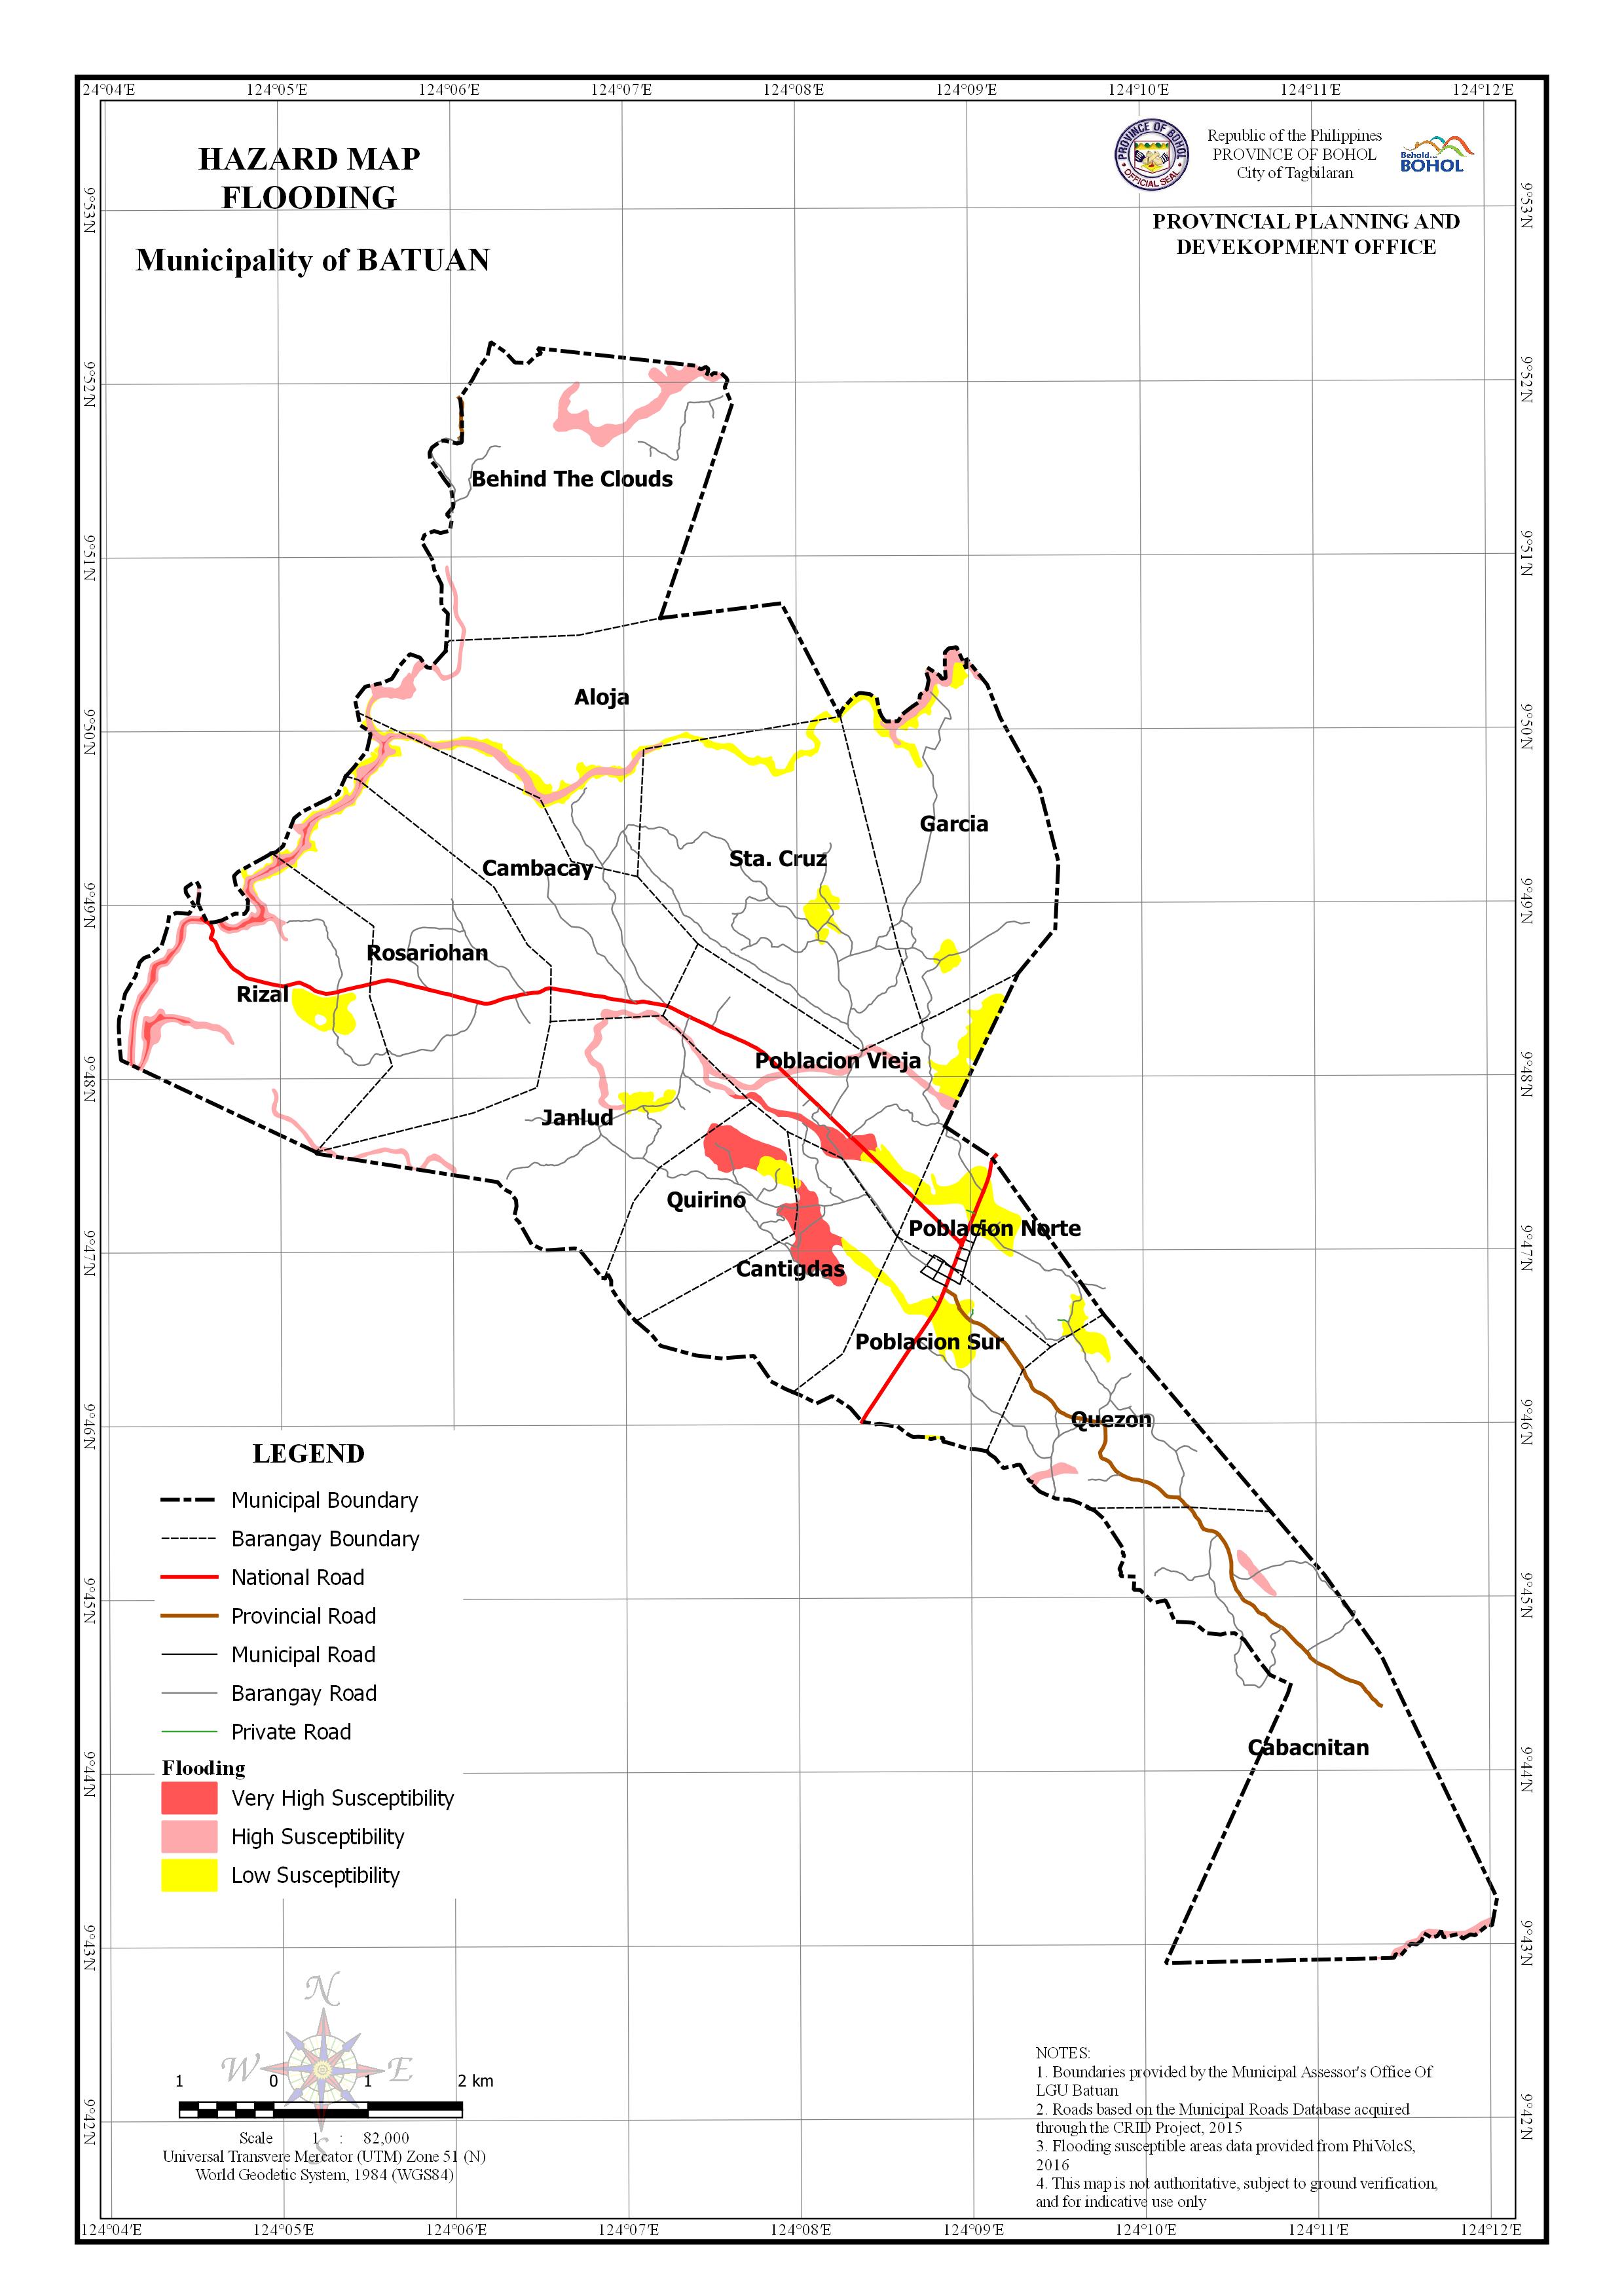
AREA EXPOSED TO FLOODING HAZARD BY BARANGAY
| Barangay | Area | Area Exposed to Very High Susceptibility | Area Exposed to High Susceptibility | Area Exposed to Low Susceptibility | |||
| (Hectares) | (Hectares) | Percentage | (Hectares) | Percentage | (Hectares) | Percentage | |
| Aloja | 703.38 | 1.043 | 0.15% | 24.934 | 3.55% | 17.603 | 2.50% |
| Behind The Clouds | 777.08 | 32.033 | 4.12% | ||||
| Cabacnitan | 1,009.19 | 10.954 | 1.09% | ||||
| Cambacay | 434.135 | 2.912 | 0.67% | 8.099 | 1.87% | 5.948 | 1.37% |
| Cantigdas | 326.134 | 32.39 | 9.93% | 5.036 | 1.54% | ||
| Garcia | 565.007 | 13.286 | 2.35% | 21.219 | 3.76% | ||
| Janlud | 506.905 | 0.789 | 0.16% | 15.814 | 3.12% | 8.595 | 1.70% |
| Poblacion Norte | 224.341 | 44.302 | 19.75% | ||||
| Poblacion Sur | 317.725 | 0.002 | 0.00% | 30.163 | 9.49% | ||
| Poblacion Vieja | 447.363 | 17.325 | 3.87% | 15.912 | 3.56% | 36.476 | 8.15% |
| Quezon | 344.134 | 3.946 | 1.15% | 6.671 | 1.94% | ||
| Quirino | 269.747 | 27.865 | 10.33% | 7.076 | 2.62% | ||
| Rizal | 583.21 | 23.228 | 3.98% | 17.757 | 3.05% | 21.278 | 3.65% |
| Rosariohan | 588.702 | 4.66 | 0.79% | 5.761 | 0.98% | 5.163 | 0.88% |
| Sta. Cruz | 676.062 | 0.54 | 0.08% | 20.801 | 3.08% | ||
| Total | 7,773.12 | 110.21 | 1.42% | 149.037 | 1.92% | 230.329 | 2.96% |