
Download in PDF and JPG format
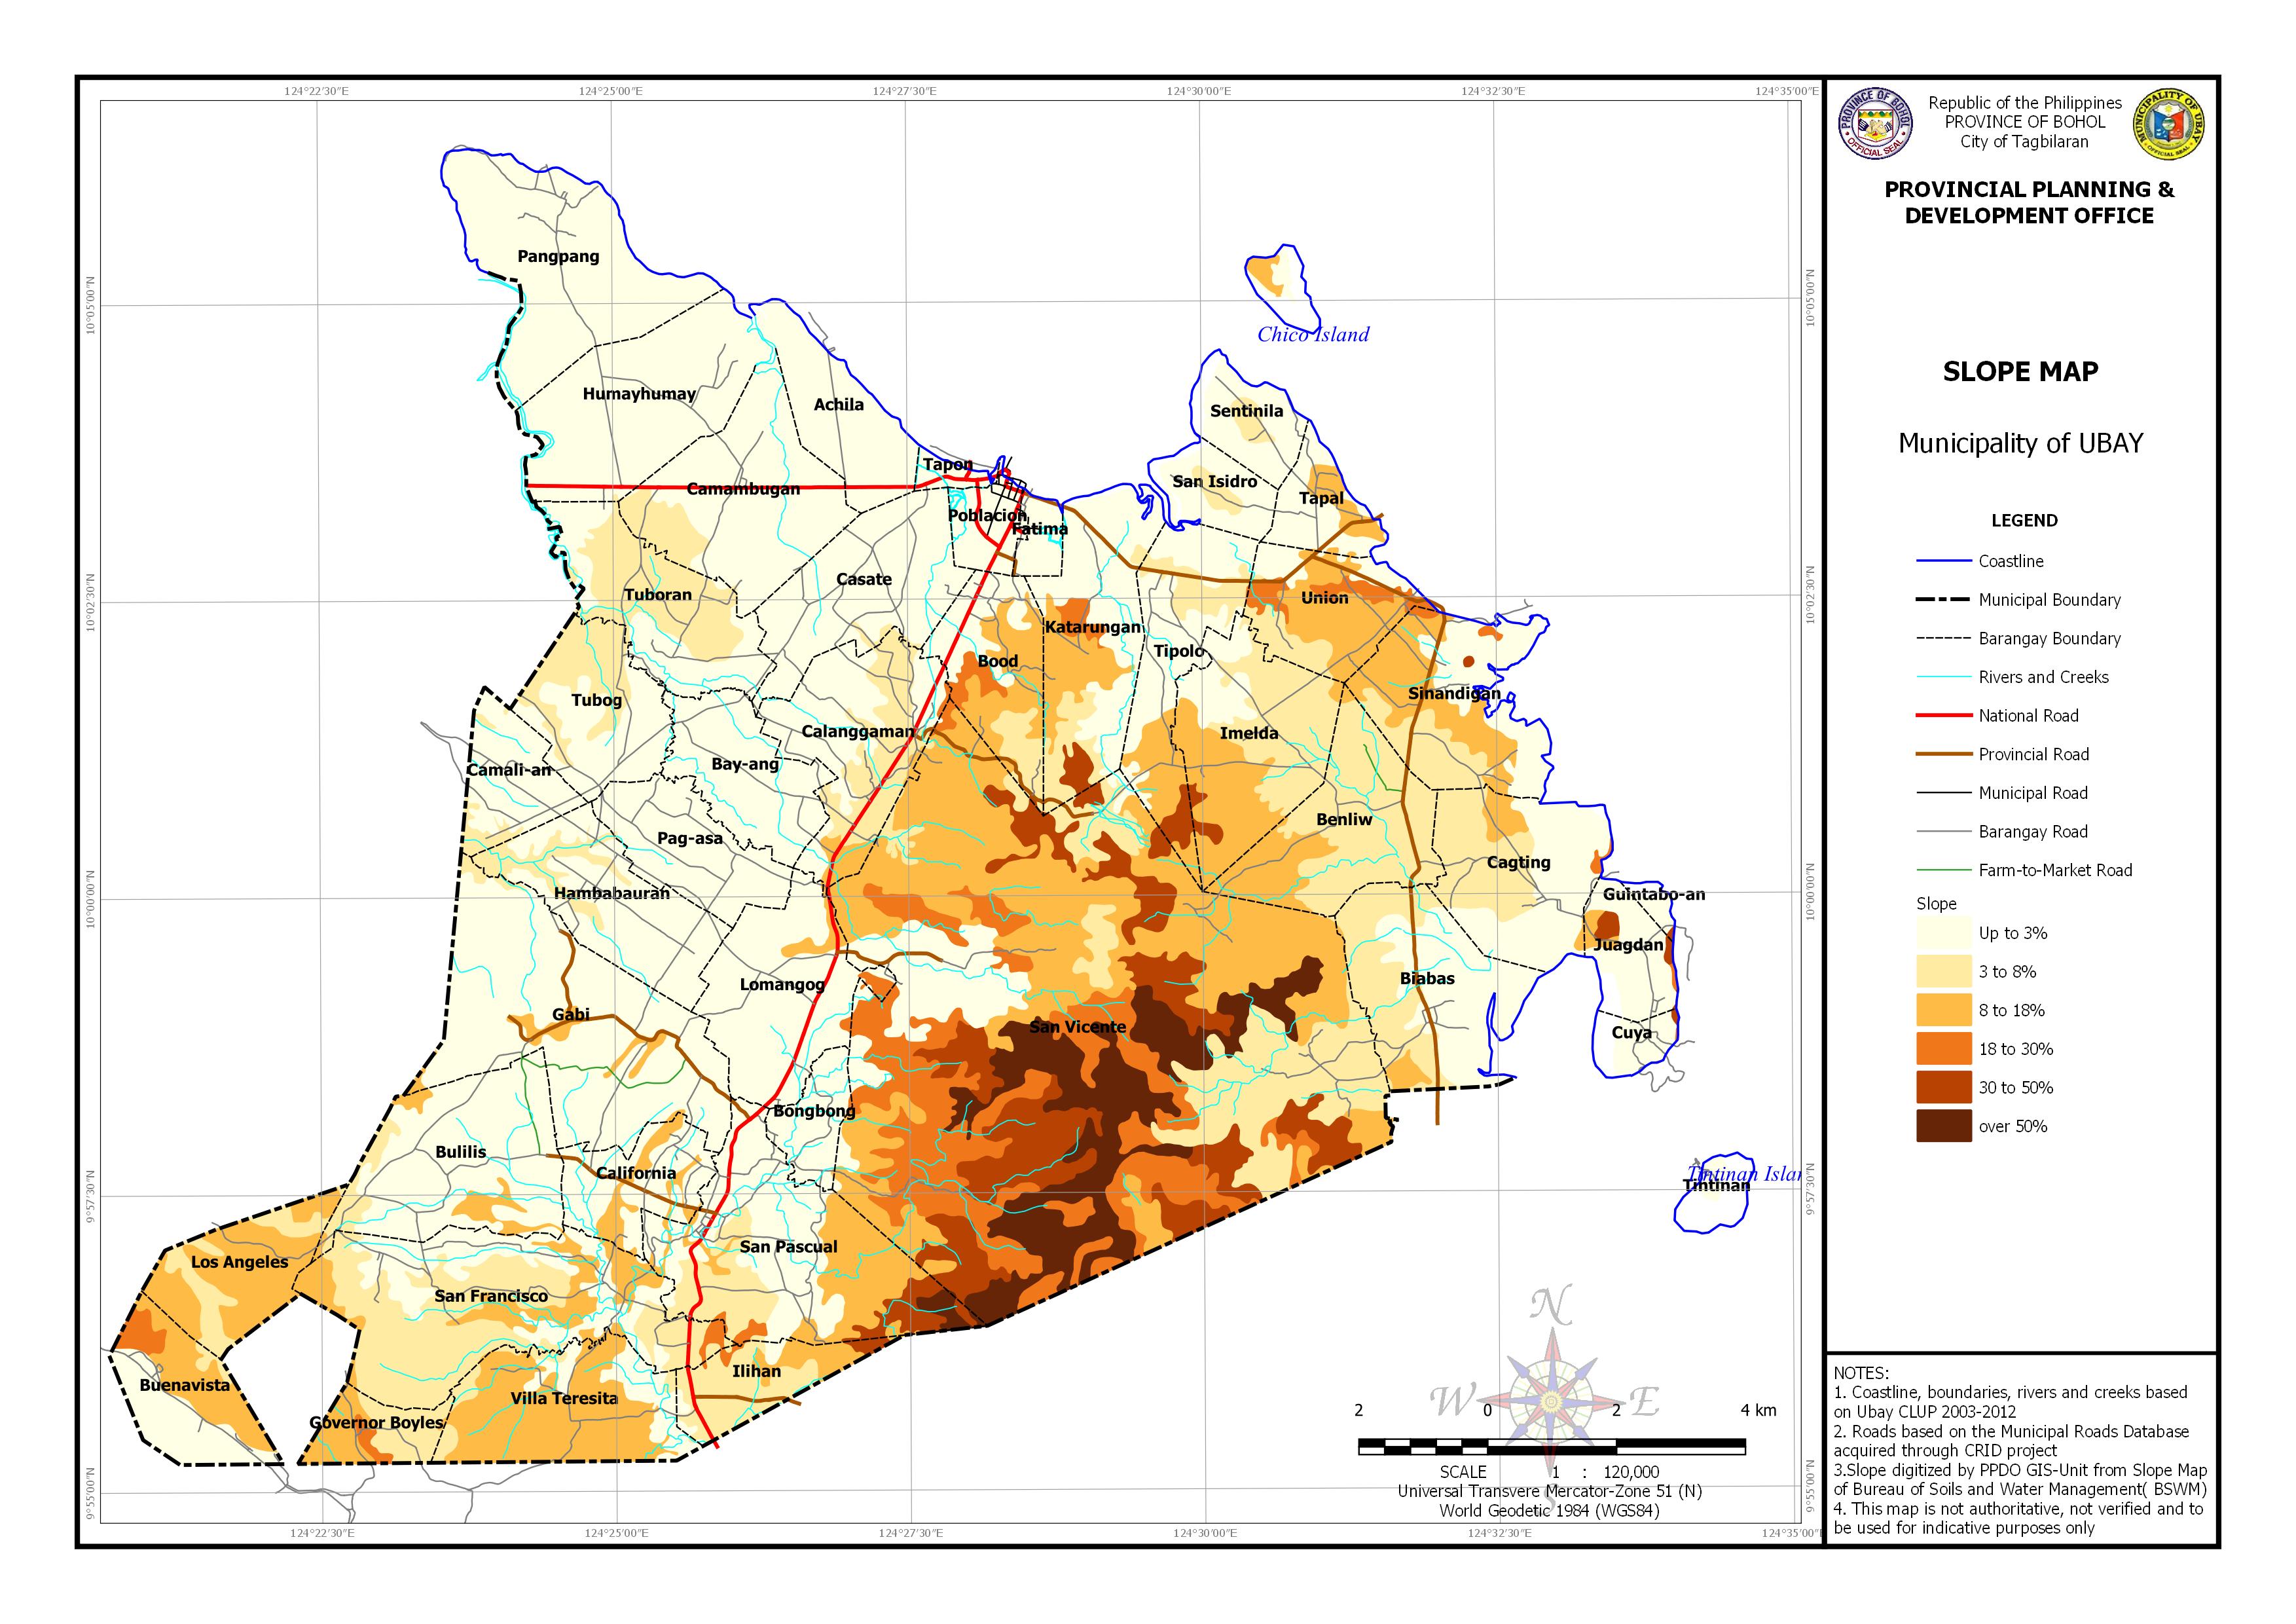
AREA EXPOSED TO SLOPE BY BARANGAY
| Barangay | Area | 18-30% Slope | 30-50% Slope | Over 50% Slope | |||
| (Hectares) | (Hectares) | Percentage | (Hectares) | Percentage | (Hectares) | Percentage | |
| Biabas | 651.773 | 0.018 | 0.00% | ||||
| Bongbong | 171.884 | 1.768 | 1.03% | ||||
| Bood | 416.584 | 39.164 | 9.40% | 2.056 | 0.49% | ||
| Buenavista | 387.243 | 39.354 | 10.16% | ||||
| Cagting | 599.799 | 8.425 | 1.41% | ||||
| Calanggaman | 626.032 | 6.104 | 0.98% | ||||
| Cuya | 104.240 | 1.795 | 1.72% | 2.580 | 2.48% | ||
| Governor Boyles | 187.582 | 19.748 | 10.53% | ||||
| Guintabo-an | 34.340 | 2.093 | 6.10% | ||||
| Ilihan | 276.900 | 8.477 | 3.06% | 12.182 | 4.40% | ||
| Imelda | 665.930 | 20.256 | 3.04% | ||||
| Juagdan | 229.230 | 3.256 | 1.42% | 23.096 | 10.08% | ||
| Katarungan | 662.961 | 35.241 | 5.32% | 30.887 | 4.66% | ||
| Lomangog | 619.483 | 17.369 | 2.80% | ||||
| San Francisco | 1124.516 | 15.649 | 1.39% | ||||
| San Pascual | 995.168 | 16.176 | 1.63% | 71.280 | 7.16% | 31.822 | 3.20% |
| San Vicente | 5232.845 | 998.169 | 19.08% | 880.506 | 16.83% | 835.910 | 15.97% |
| Sinandigan | 618.453 | 13.267 | 2.15% | 3.518 | 0.57% | ||
| Tipolo | 530.348 | 1.228 | 0.23% | 31.104 | 5.87% | ||
| Union | 402.419 | 77.670 | 19.30% | ||||
| Total | 25218.055 | 1302.879 | 91.60% | 1079.558 | 61.66% | 867.732 | 19.17% |