
Download in PDF and JPG format
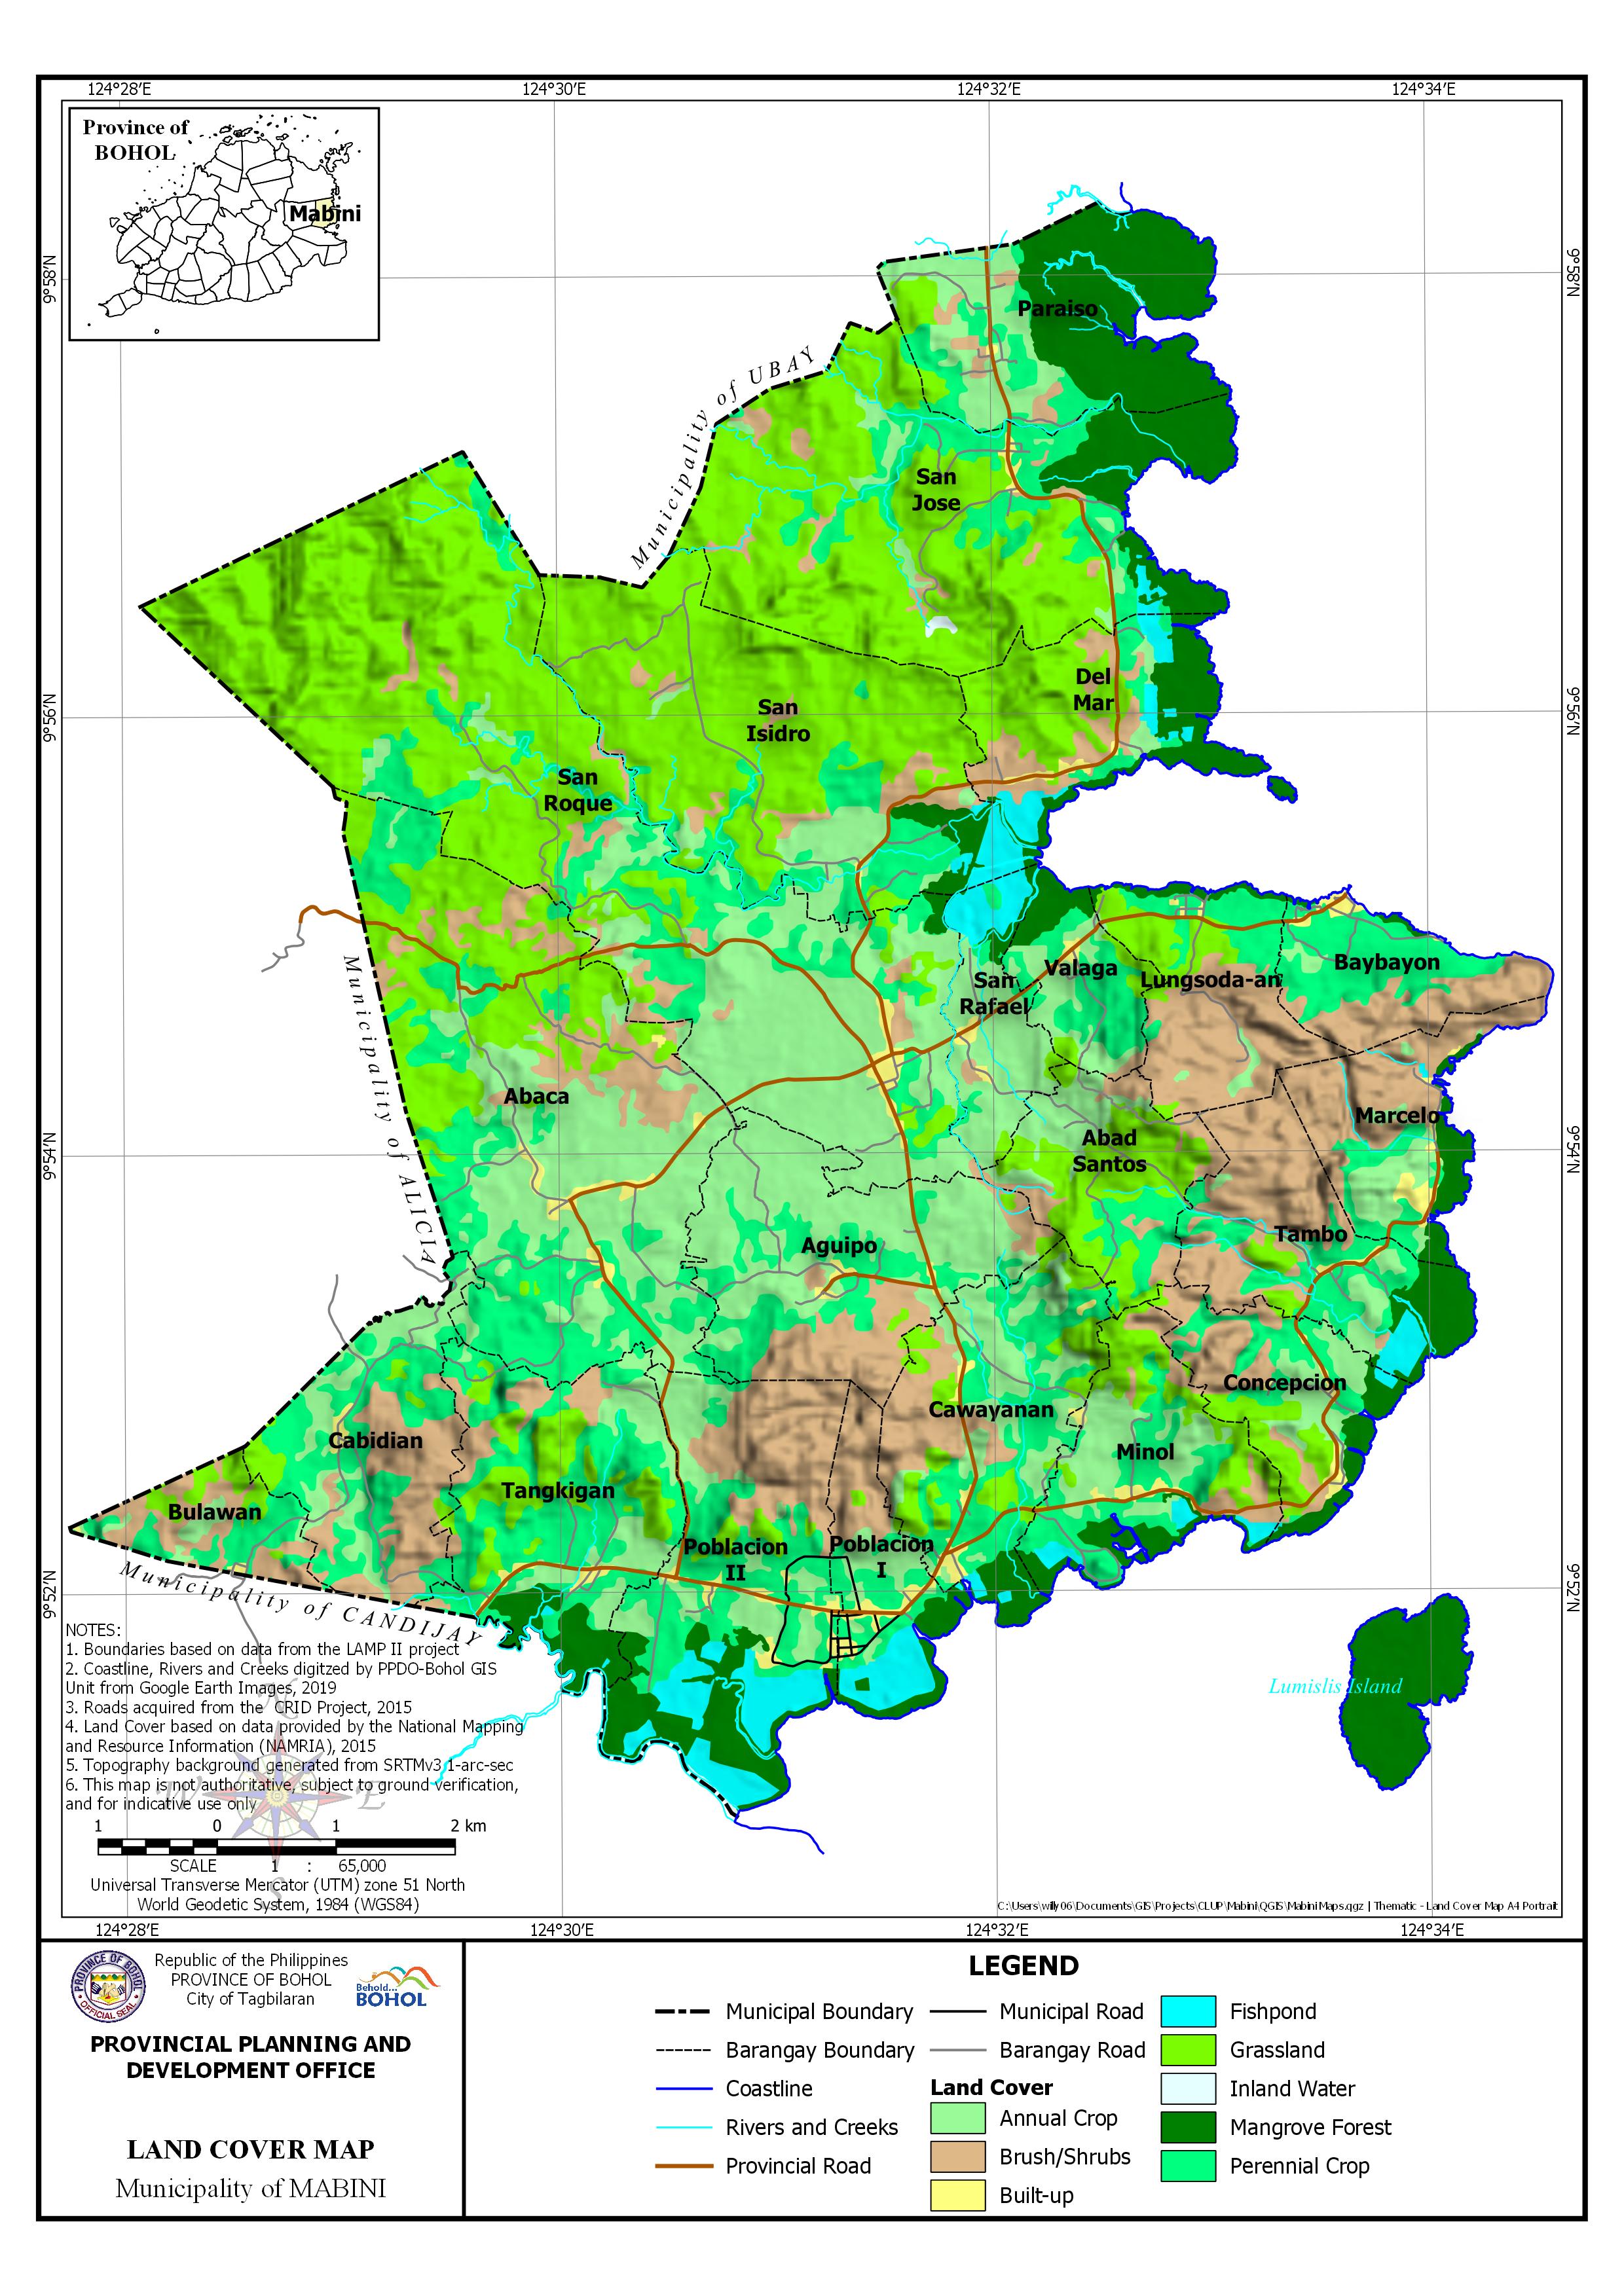
AREA PER LAND COVER BY BARANGAY
| Barangay | Area | Annual Crop | Brush/Shrubs | Built-up | Fishpond | Grassland | Inland Water | Mangrove Forest | Perennial Crop | ||||||||
| Hectares | Hectares | Percentage | Hectares | Percentage | Hectares | Percentage | Hectares | Percentage | Hectares | Percentage | Hectares | Percentage | Hectares | Percentage | Hectares | Percentage | |
| Abaca | 944.471 | 335.955 | 35.57% | 96.014 | 10.17% | 18.011 | 1.91% | 244.627 | 25.90% | 249.863 | 26.46% | ||||||
| Abad Santos | 232.914 | 48.424 | 20.79% | 38.222 | 16.41% | 113.9 | 48.90% | 32.368 | 13.90% | ||||||||
| Aguipo | 442.045 | 249.337 | 56.41% | 91.512 | 20.70% | 5.413 | 1.23% | 6.034 | 1.37% | 89.748 | 20.30% | ||||||
| Baybayon | 185.445 | 4.852 | 2.62% | 76.027 | 41.00% | 8.191 | 4.42% | 3.833 | 2.07% | 92.542 | 49.90% | ||||||
| Bulawan | 126.765 | 13.937 | 11.00% | 52.736 | 41.60% | 1.879 | 1.48% | 21.672 | 17.10% | 36.542 | 28.83% | ||||||
| Cabidian | 313.637 | 69.053 | 22.02% | 104.789 | 33.41% | 4.411 | 1.41% | 16.706 | 5.33% | 118.678 | 37.84% | ||||||
| Cawayanan | 377.966 | 104.904 | 27.76% | 60.841 | 16.10% | 12.064 | 3.19% | 3.84 | 1.02% | 64.822 | 17.15% | 21.76 | 5.76% | 109.735 | 29.03% | ||
| Concepcion | 219.29 | 41.862 | 19.09% | 59.502 | 27.13% | 7.866 | 3.59% | 2.446 | 1.12% | 39.932 | 18.21% | 28.715 | 13.09% | 38.967 | 17.77% | ||
| Del Mar | 286.973 | 9.291 | 3.24% | 55.54 | 19.35% | 5.569 | 1.94% | 27.314 | 9.52% | 99.768 | 34.77% | 72.003 | 25.09% | 17.489 | 6.09% | ||
| Lungsoda-an | 241.967 | 7.907 | 3.27% | 129.559 | 53.54% | 2.044 | 0.85% | 44.629 | 18.44% | 11.031 | 4.56% | 46.797 | 19.34% | ||||
| Marcelo | 218.321 | 38.322 | 17.55% | 109.898 | 50.34% | 11.666 | 5.34% | 0.815 | 0.37% | 30.298 | 13.88% | 27.321 | 12.51% | ||||
| Minol | 284.162 | 69.781 | 24.56% | 30.366 | 10.69% | 8.734 | 3.07% | 12.894 | 4.54% | 57.689 | 20.30% | 32.523 | 11.45% | 72.175 | 25.40% | ||
| Paraiso | 388.851 | 91.099 | 23.43% | 15.942 | 4.10% | 0.712 | 0.18% | 18.873 | 4.85% | 1.396 | 0.36% | 212.647 | 54.69% | 48.182 | 12.39% | ||
| Poblacion I | 181.389 | 27.196 | 14.99% | 47.73 | 26.31% | 12.862 | 7.09% | 32.061 | 17.68% | 1.846 | 1.02% | 25.612 | 14.12% | 34.081 | 18.79% | ||
| Poblacion II | 519.893 | 84.87 | 16.33% | 114.064 | 21.94% | 17.82 | 3.43% | 78.562 | 15.11% | 12.99 | 2.50% | 4.625 | 0.89% | 84.189 | 16.19% | 122.772 | 23.62% |
| San Isidro | 733.392 | 60.075 | 8.19% | 42.089 | 5.74% | 1.49 | 0.20% | 20.485 | 2.79% | 490.612 | 66.90% | 25.69 | 3.50% | 92.951 | 12.67% | ||
| San Jose | 834.795 | 32.004 | 3.83% | 33.038 | 3.96% | 5.046 | 0.60% | 6.249 | 0.75% | 526.539 | 63.07% | 2.329 | 0.28% | 111.288 | 13.33% | 118.301 | 14.17% |
| San Rafael | 149.486 | 96.29 | 64.41% | 2.463 | 1.65% | 4.231 | 2.83% | 25.373 | 16.97% | 4.611 | 3.09% | 7.32 | 4.90% | 9.198 | 6.15% | ||
| San Roque | 1,376.05 | 397.45 | 28.88% | 51.707 | 3.76% | 15.204 | 1.11% | 0.005 | 0.00% | 730.861 | 53.11% | 4.94 | 0.36% | 175.878 | 12.78% | ||
| Tambo | 303.148 | 24.902 | 8.22% | 145.65 | 48.05% | 3.788 | 1.25% | 14.002 | 4.62% | 12.161 | 4.01% | 40.351 | 13.31% | 62.293 | 20.55% | ||
| Tangkigan | 423.821 | 64.332 | 15.18% | 41.009 | 9.68% | 8.364 | 1.97% | 1.197 | 0.28% | 86.315 | 20.37% | 1.091 | 0.26% | 44.034 | 10.39% | 177.479 | 41.88% |
| Valaga | 135.718 | 40.811 | 30.07% | 3.319 | 2.45% | 3.669 | 2.70% | 12.788 | 9.42% | 20.363 | 15.00% | 54.769 | 40.36% | ||||
| Sub-Total | 8,920.49 | 1,912.66 | 21.44% | 1,402.02 | 15.72% | 159.032 | 1.78% | 225.242 | 2.53% | 2,607.38 | 29.23% | 9.442 | 0.11% | 776.596 | 8.71% | 1,828.13 | 20.49% |
| Lumislis Island | 114.701 | 114.701 | 100.00% | ||||||||||||||
| TOTAL | 9,035.19 | 1,912.66 | 21.17% | 1,402.02 | 15.52% | 159.032 | 1.76% | 225.242 | 2.49% | 2,607.38 | 28.86% | 9.442 | 0.10% | 891.297 | 9.87% | 1,828.13 | 20.23% |