
Download in PDF and JPG format
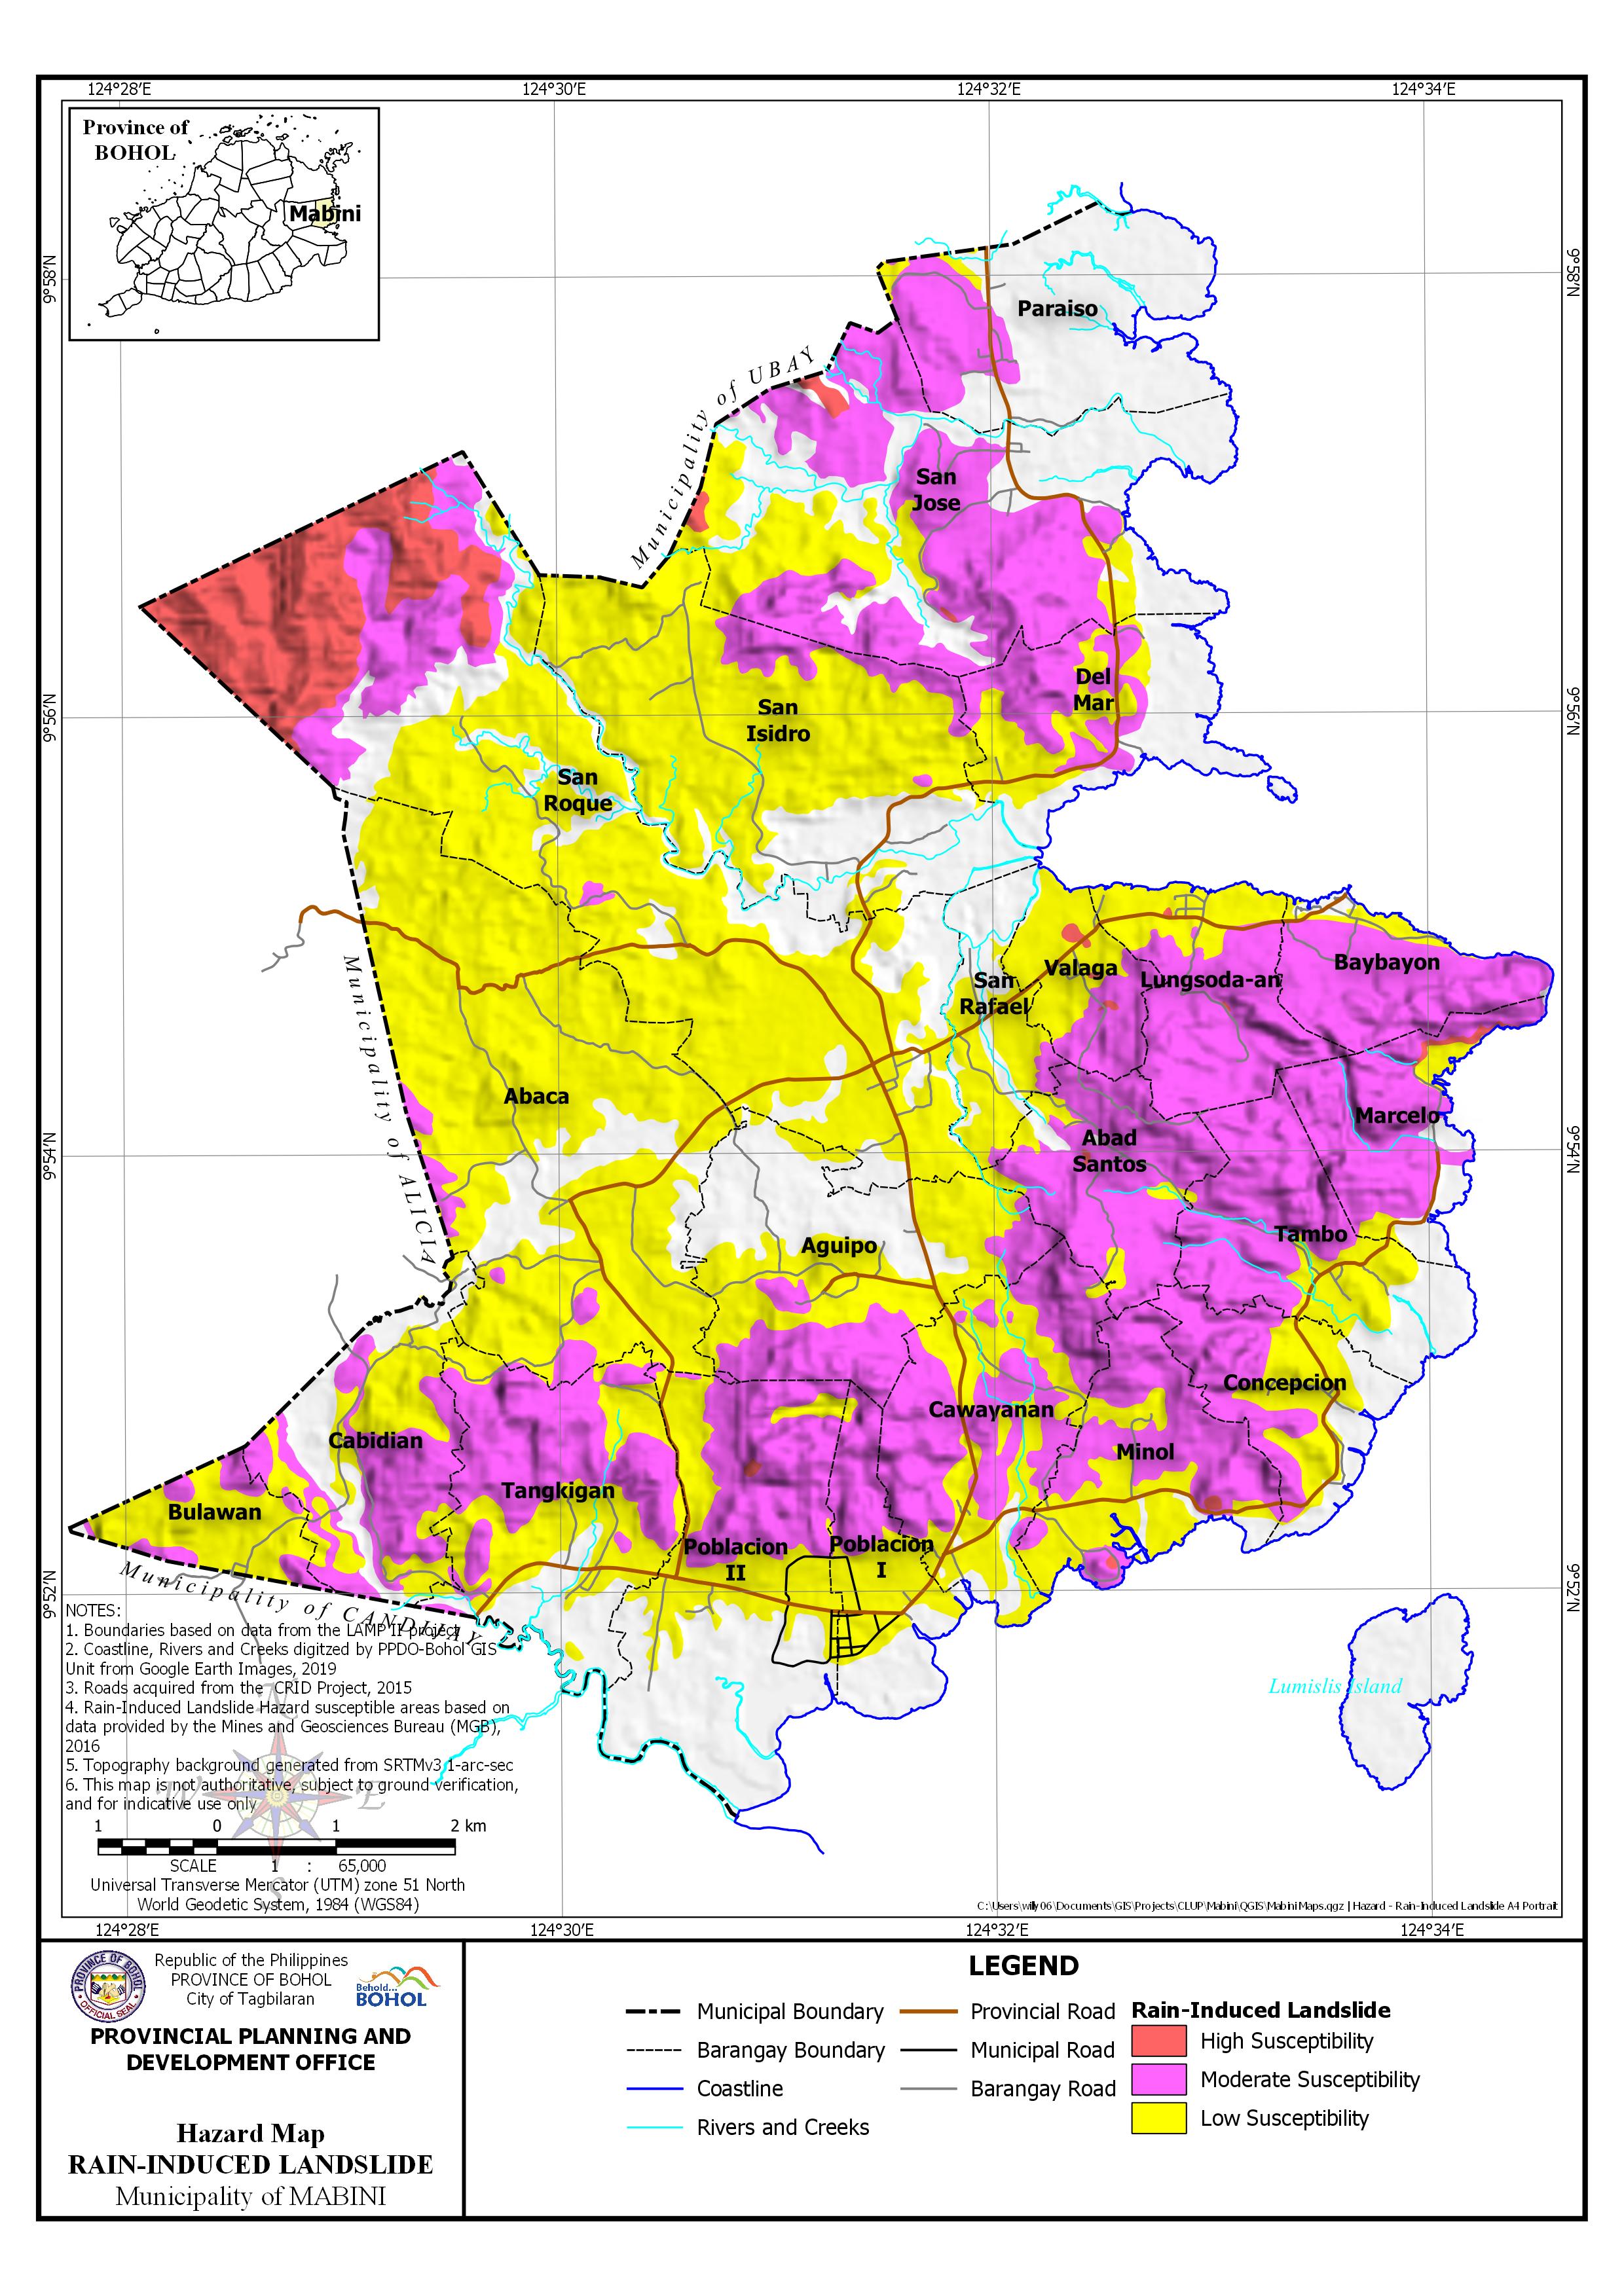
AREA EXPOSED TO RAIN-INDUCED LANDSLIDE BY BARANGAY
| Barangay | Area | Barangay Area Exposed to High Susceptibility | Barangay Area Exposed to Moderate Susceptibility | Barangay Area Exposed to Low Susceptibility | |||
| Hectares | Hectares | Percentage | Hectares | Percentage | Hectares | Percentage | |
| Abaca | 944.471 | 33.968 | 3.60% | 803.967 | 85.12% | ||
| Abad Santos | 232.914 | 0.885 | 0.38% | 201.147 | 86.36% | 24.736 | 10.62% |
| Aguipo | 442.045 | 106.153 | 24.01% | 189.066 | 42.77% | ||
| Baybayon | 185.445 | 161.202 | 86.93% | 16.643 | 8.98% | ||
| Bulawan | 126.765 | 27.99 | 22.08% | 97.802 | 77.15% | ||
| Cabidian | 313.637 | 129.795 | 41.38% | 117.268 | 37.39% | ||
| Cawayanan | 377.966 | 210.154 | 55.60% | 152.335 | 40.30% | ||
| Concepcion | 219.29 | 94.034 | 42.88% | 80.172 | 36.56% | ||
| Del Mar | 286.973 | 94.844 | 33.05% | 83.079 | 28.95% | ||
| Lungsoda-an | 241.967 | 1.091 | 0.45% | 175.58 | 72.56% | 64.813 | 26.79% |
| Marcelo | 218.321 | 5.347 | 2.45% | 163.403 | 74.85% | 17.594 | 8.06% |
| Minol | 284.162 | 2.901 | 1.02% | 159.966 | 56.29% | 109.366 | 38.49% |
| Paraiso | 388.851 | 85.416 | 21.97% | 8.617 | 2.22% | ||
| Poblacion I | 181.389 | 51.109 | 28.18% | 73.336 | 40.43% | ||
| Poblacion II | 519.893 | 1.687 | 0.32% | 151.301 | 29.10% | 144.113 | 27.72% |
| San Isidro | 733.392 | 47.232 | 6.44% | 509.339 | 69.45% | ||
| San Jose | 834.795 | 12.156 | 1.46% | 392.509 | 47.02% | 143.036 | 17.13% |
| San Rafael | 149.486 | 8 | 5.35% | 80.103 | 53.59% | ||
| San Roque | 1,376.05 | 280.853 | 20.41% | 151.099 | 10.98% | 697.829 | 50.71% |
| Tambo | 303.148 | 178.575 | 58.91% | 62.103 | 20.49% | ||
| Tangkigan | 423.821 | 187.748 | 44.30% | 156.468 | 36.92% | ||
| Valaga | 135.718 | 3.969 | 2.93% | 51.277 | 37.78% | 78.474 | 57.82% |
| Sub-Total | 8,920.49 | 308.887 | 3.46% | 2,862.50 | 32.09% | 3,710.26 | 41.59% |
| Lumislis Island | 114.701 | ||||||
| TOTAL | 9,035.19 | 308.887 | 3.42% | 2,862.50 | 31.68% | 3,710.26 | 41.07% |