
Download in PDF and JPG format
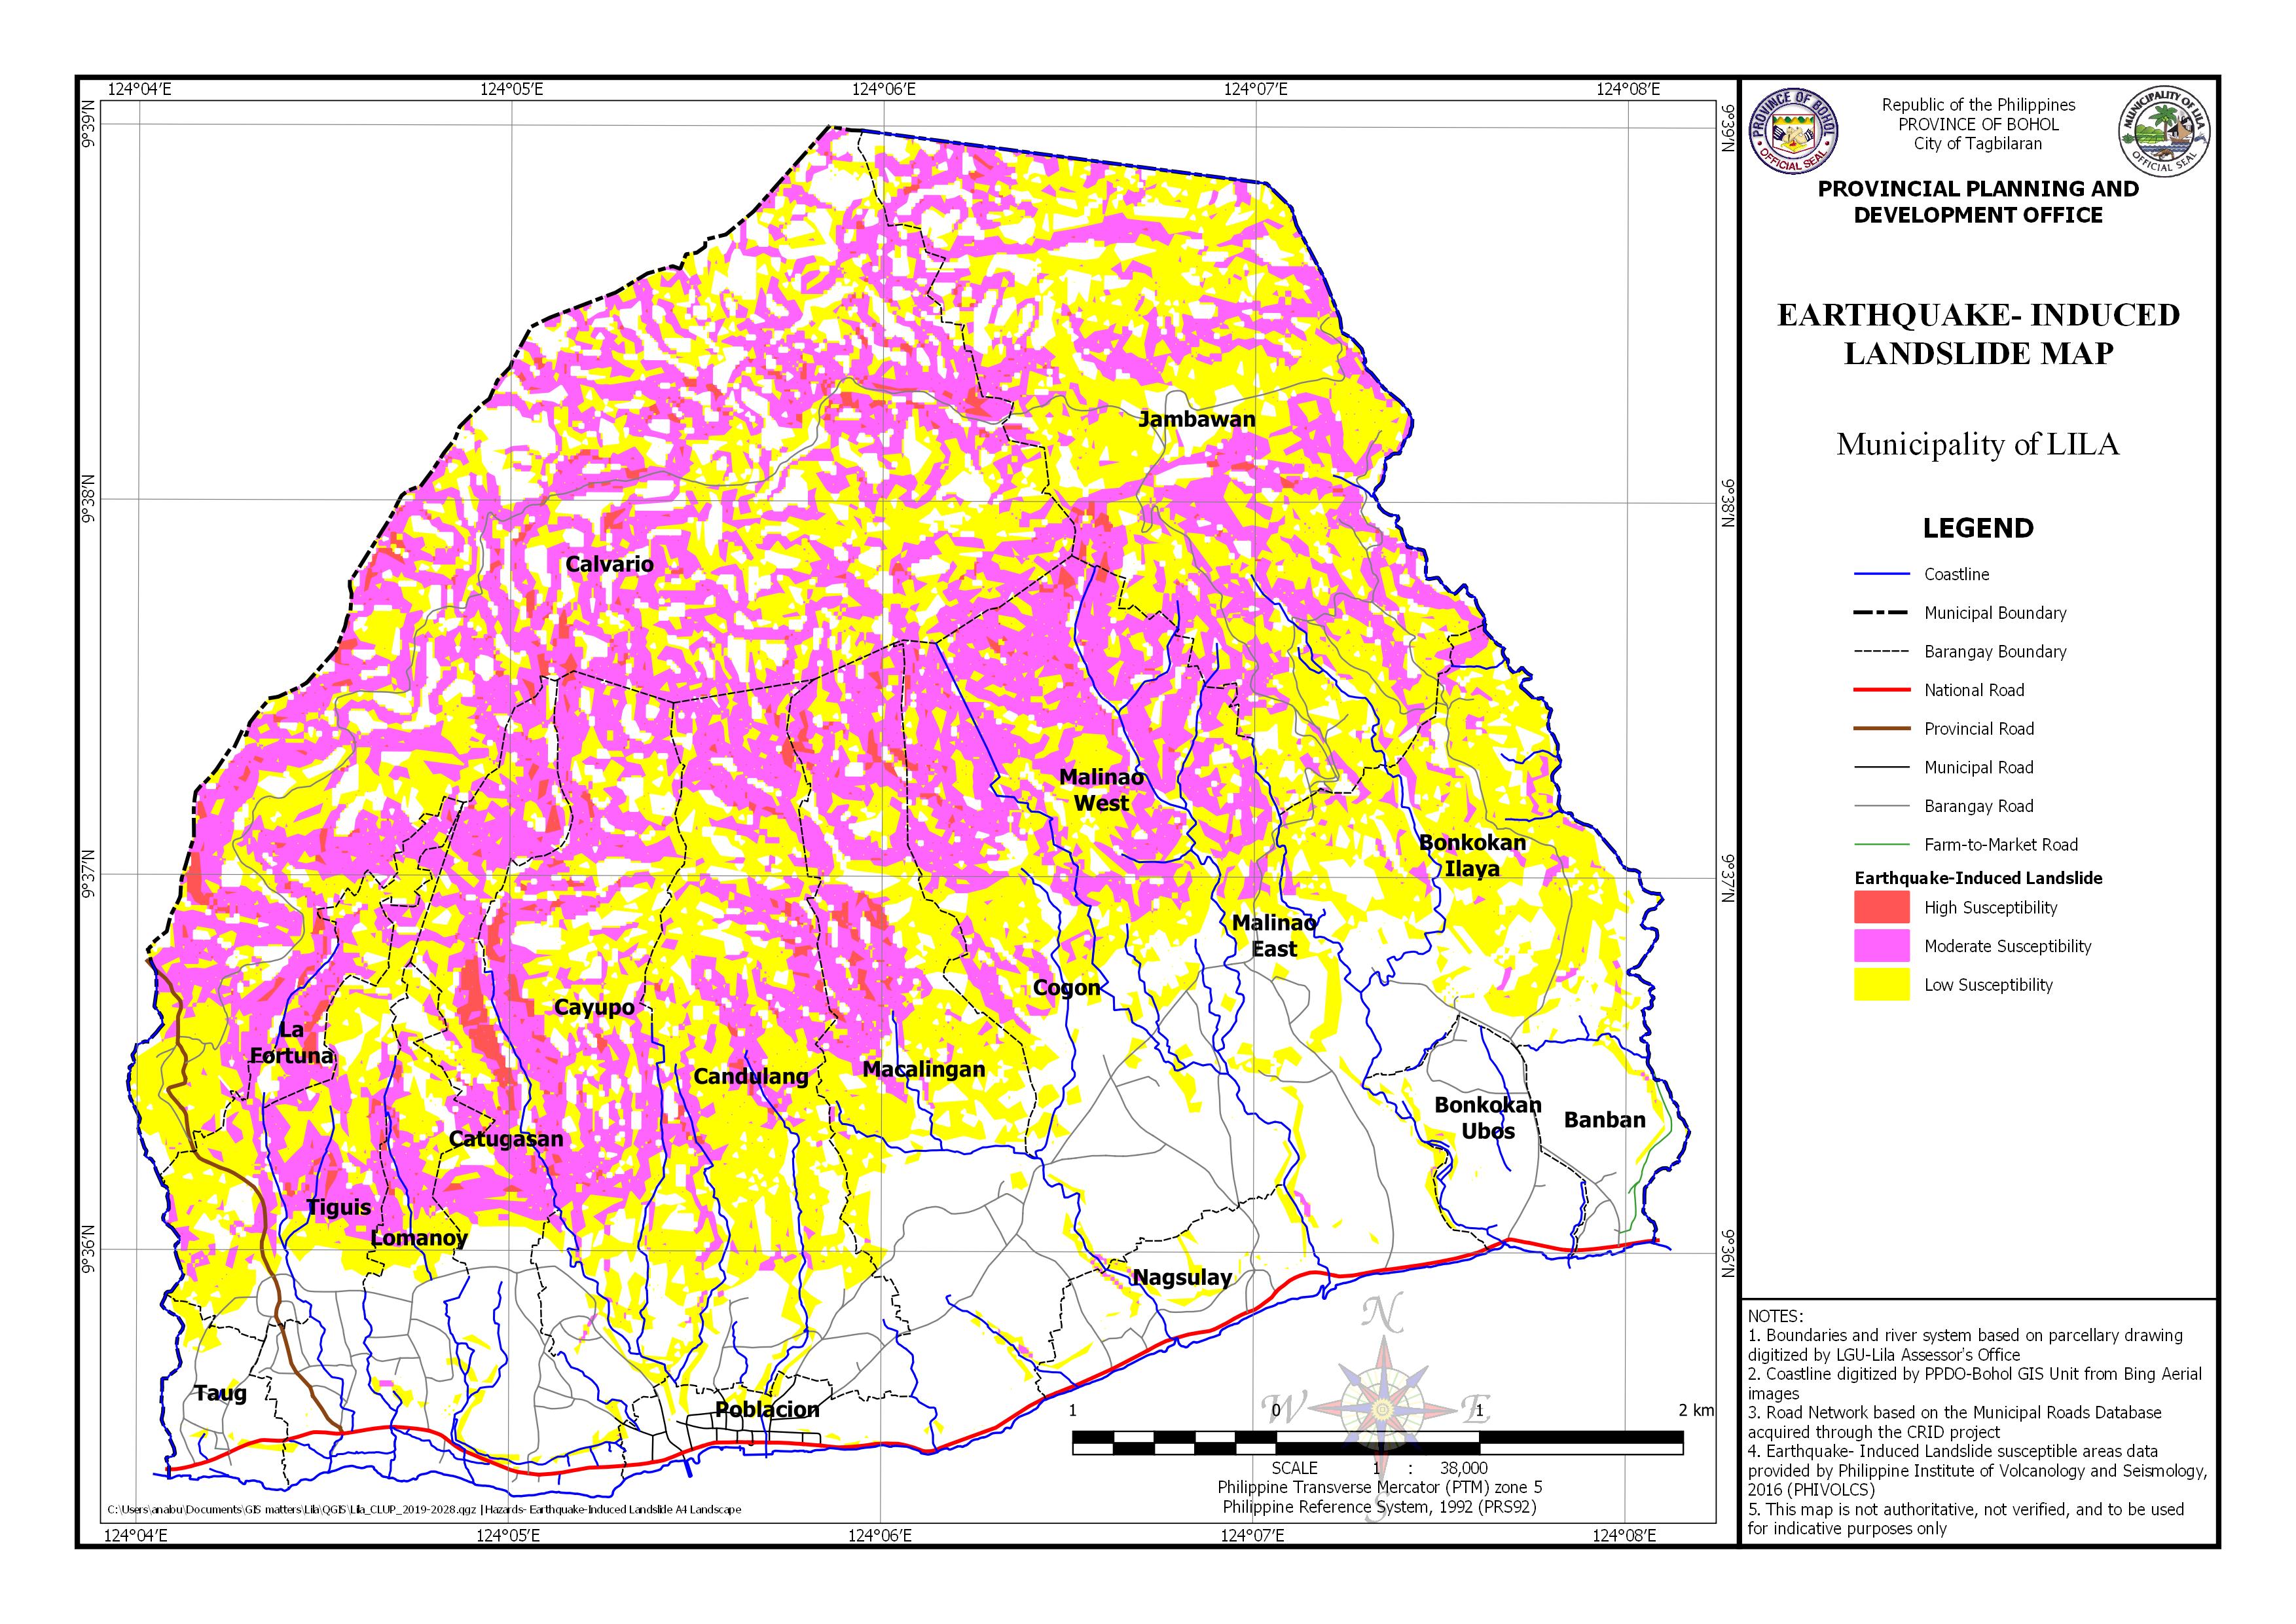
AREA EXPOSED TO EARTHQUAKE-INDUCED LANDSLIDE BY BARANGAY
| Barangay | Area | Area Exposed to High Susceptibility | Area Exposed to Low Susceptibility | Area Exposed to Moderate Susceptibility | |||
| (Hectares) | (Hectares) | Percentage | (Hectares) | Percentage | (Hectares) | Percentage | |
| Banban | 54.651 | 3.369 | 6.17% | 0.187 | 0.34% | ||
| Bonkokan Ilaya | 235.481 | 0.190 | 0.08% | 121.937 | 51.78% | 22.091 | 9.38% |
| Bonkokan Ubos | 66.327 | 3.772 | 5.69% | 0.145 | 0.22% | ||
| Calvario | 806.148 | 36.520 | 4.53% | 293.216 | 36.37% | 343.267 | 42.58% |
| Candulang | 293.490 | 8.311 | 2.83% | 131.389 | 44.77% | 74.756 | 25.47% |
| Catugasan | 171.121 | 10.404 | 6.08% | 37.557 | 21.95% | 48.873 | 28.56% |
| Cayupo | 217.302 | 10.700 | 4.92% | 74.623 | 34.34% | 83.266 | 38.32% |
| Cogon | 207.025 | 3.041 | 1.47% | 52.845 | 25.53% | 45.456 | 21.96% |
| Jambawan | 499.561 | 7.838 | 1.57% | 252.484 | 50.54% | 173.708 | 34.77% |
| La Fortuna | 90.095 | 2.970 | 3.30% | 42.320 | 46.97% | 27.919 | 30.99% |
| Lomanoy | 85.477 | 1.756 | 2.05% | 24.049 | 28.14% | 15.097 | 17.66% |
| Macalingan | 283.497 | 9.513 | 3.36% | 85.024 | 29.99% | 57.796 | 20.39% |
| Malinao East | 194.783 | 1.866 | 0.96% | 46.673 | 23.96% | 42.366 | 21.75% |
| Malinao West | 150.937 | 3.925 | 2.60% | 56.513 | 37.44% | 57.264 | 37.94% |
| Nagsulay | 70.907 | 8.089 | 11.41% | 0.618 | 0.87% | ||
| Poblacion | 47.646 | 5.024 | 10.55% | 0.057 | 0.12% | ||
| Taug | 39.564 | 5.175 | 13.08% | 0.011 | 0.03% | ||
| Tiguis | 119.020 | 2.398 | 2.02% | 34.602 | 29.07% | 27.672 | 23.25% |
| Total | 3633.033 | 99.433 | 35.77% | 1278.662 | 507.74% | 1020.547 | 354.60% |