
Download in PDF and JPG format
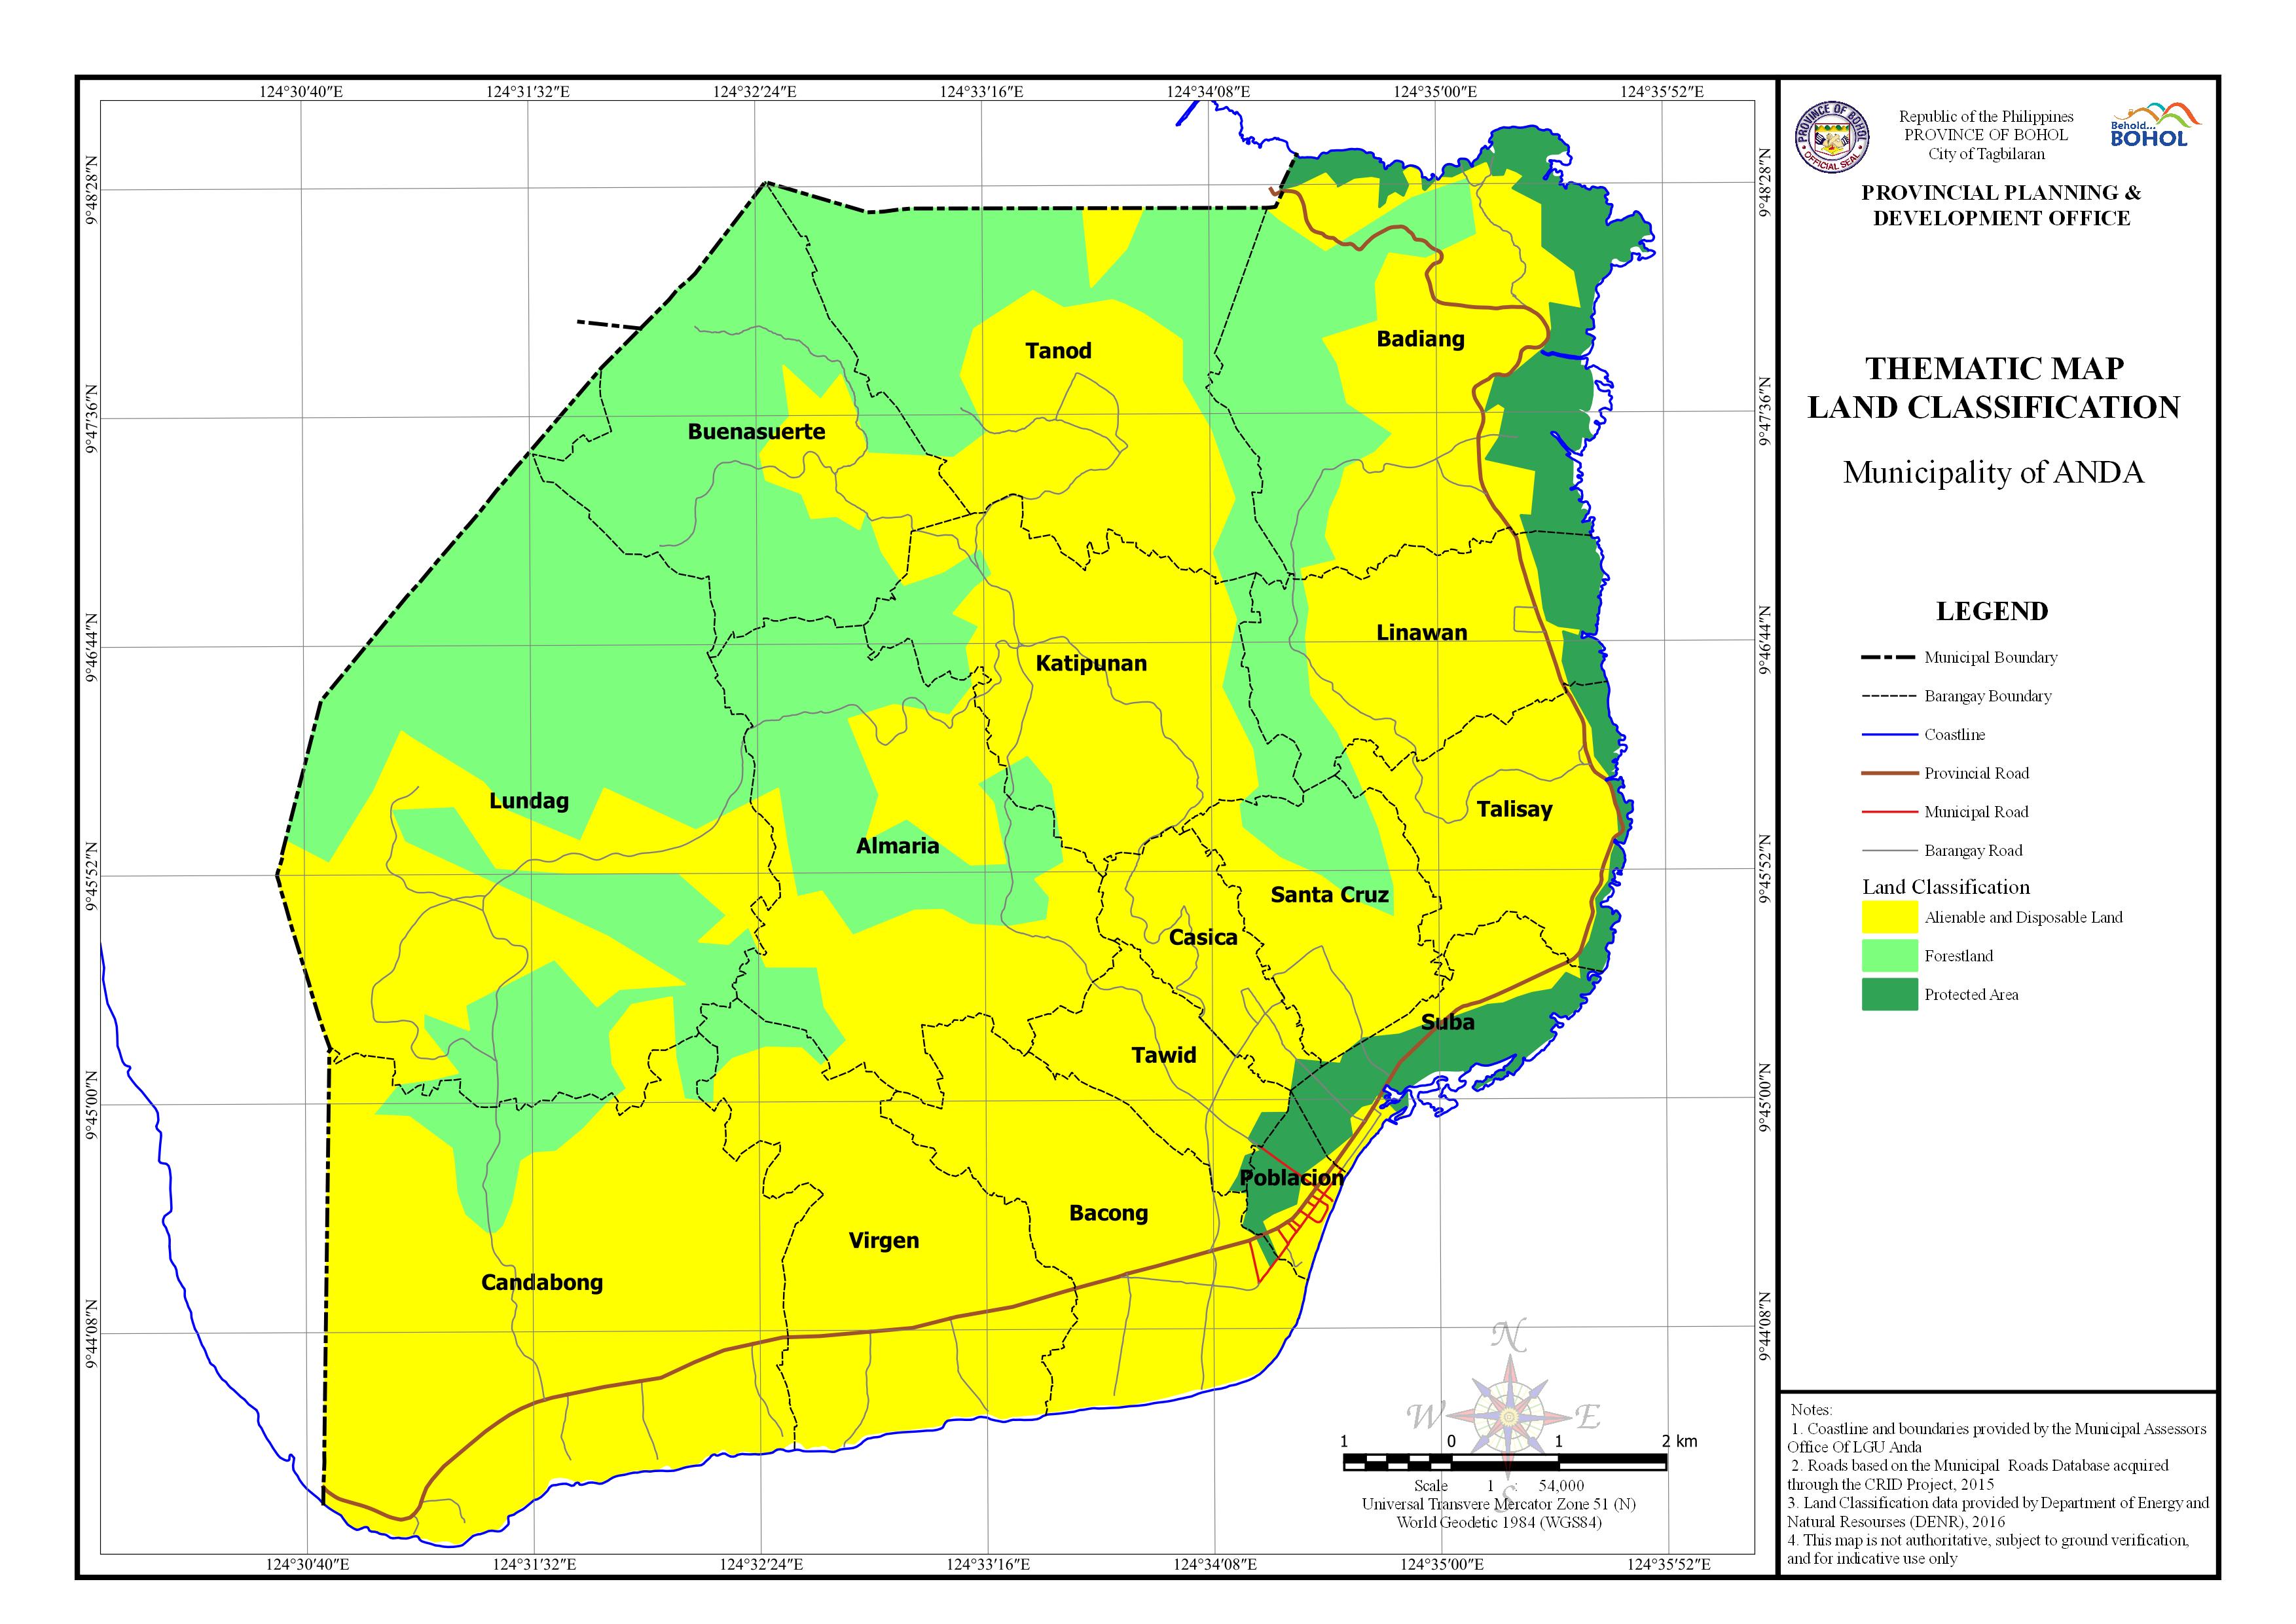
AREA PER LAND CLASSIFICATION BY BARANGAY
| Barangay | Area | Alienable and Disposable Land | Forestland | Protected Area | No Data | ||||
| (Hectares) | (Hectares) | Percentage | (Hectares) | Percentage | (Hectares) | Percentage | (Hectares) | Percentage | |
| Almaria | 586.18 | 298.516 | 50.93% | 287.664 | 49.07% | 0 | |||
| Bacong | 384.549 | 379.017 | 98.56% | 1.372 | 0.36% | 4.16 | 1.08% | ||
| Badiang | 681.255 | 314.847 | 46.22% | 211.918 | 31.11% | 142.705 | 20.95% | 11.793 | 1.73% |
| Buenasuerte | 483.765 | 87.355 | 18.06% | 396.411 | 81.94% | 0 | |||
| Candabong | 913.208 | 829.121 | 90.79% | 78.037 | 8.55% | 6.428 | 0.70% | ||
| Casica | 127.206 | 124.993 | 98.26% | 2.213 | 1.74% | ||||
| Katipunan | 437.769 | 355.165 | 81.13% | 82.603 | 18.87% | ||||
| Linawan | 308.36 | 212.528 | 68.92% | 58.175 | 18.87% | 36.519 | 11.84% | 1.138 | 0.37% |
| Lundag | 1,114.26 | 390.568 | 35.05% | 723.742 | 64.95% | ||||
| Poblacion | 51.421 | 23.808 | 46.30% | 27.131 | 52.76% | 0.483 | 0.94% | ||
| Santa Cruz | 211.921 | 155.01 | 73.15% | 56.681 | 26.75% | 0.23 | 0.11% | ||
| Suba | 150.647 | 58.816 | 39.04% | 83.3 | 55.30% | 8.533 | 5.66% | ||
| Talisay | 242.032 | 214.12 | 88.47% | 3.2 | 1.32% | 23.12 | 9.55% | 1.591 | 0.66% |
| Tanod | 611.43 | 284.538 | 46.54% | 326.922 | 53.47% | ||||
| Tawid | 142.246 | 137.275 | 96.51% | 4.971 | 3.50% | ||||
| Virgen | 438.871 | 411.154 | 93.68% | 22.579 | 5.15% | 5.138 | 1.17% | ||
| Total | 6,885.12 | 4,276.83 | 62.12% | 2,247.93 | 32.65% | 321.56 | 4.67% | 39.264 | 0.57% |