
Download in PDF and JPG format
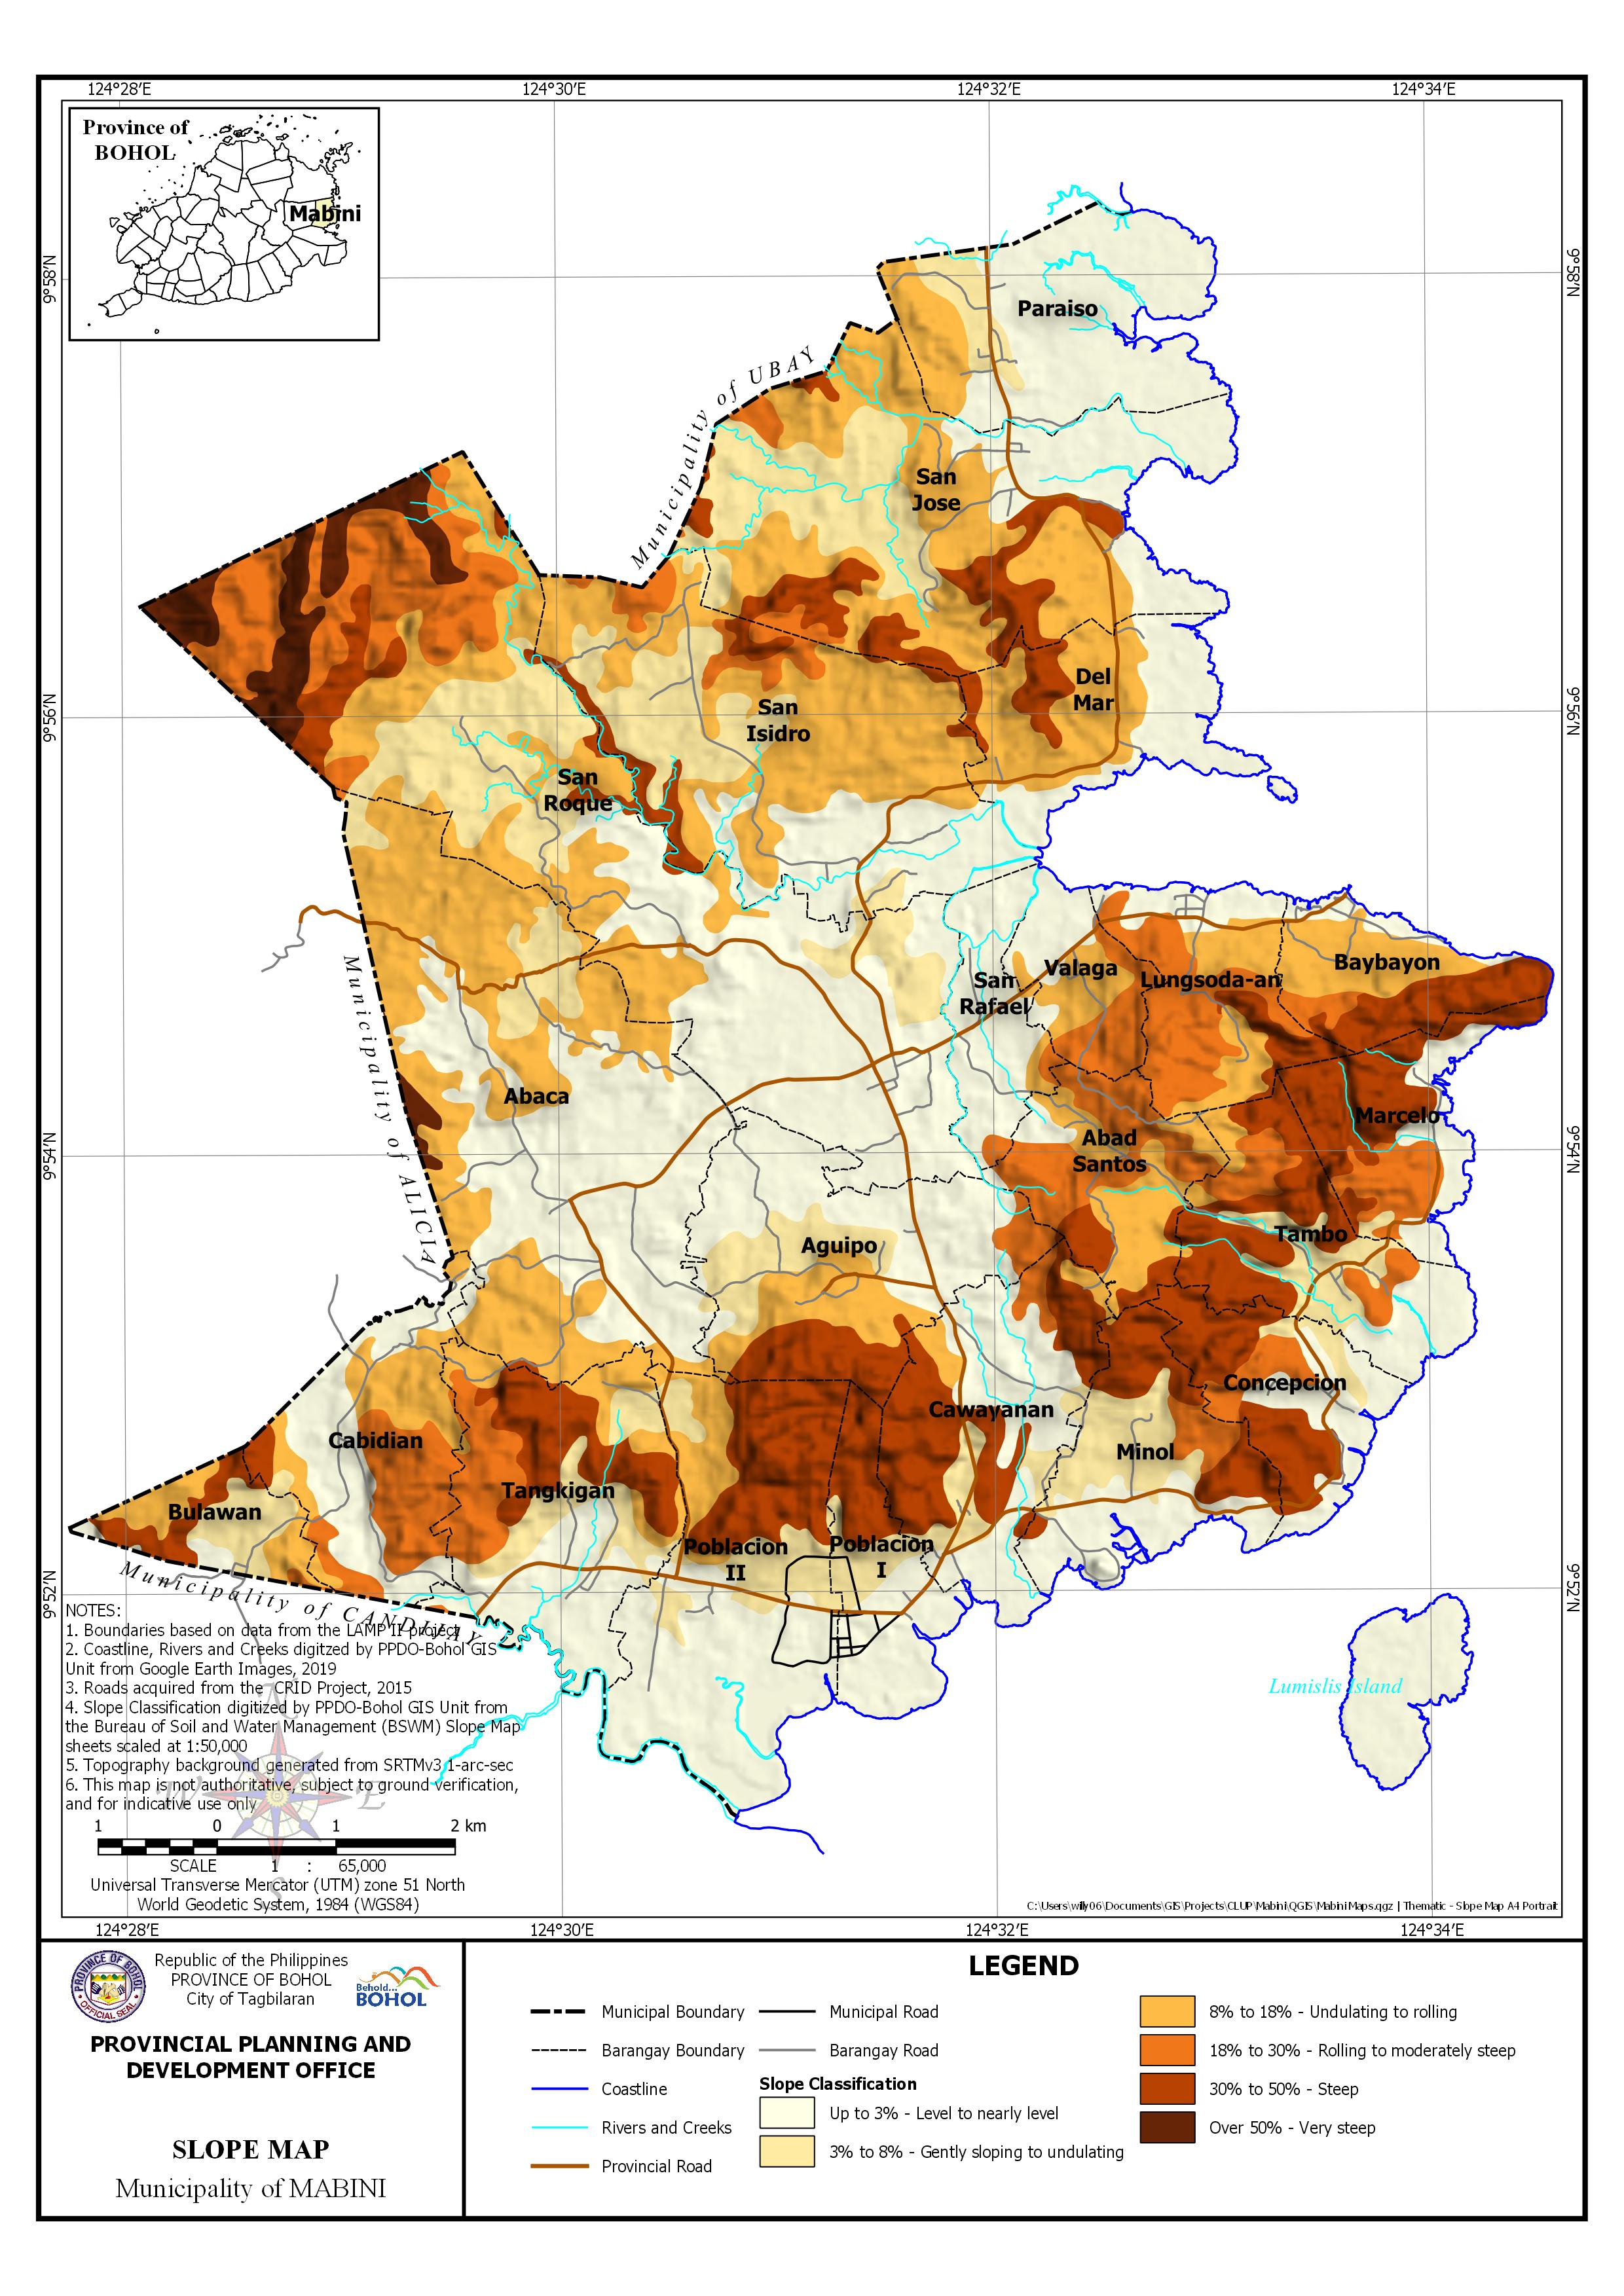
AREA PER SLOPE CLASSIFICATION BY BARANGAY
| Barangay | Area | 00 to 03% – Level to nearly level | 03 to 08% – Gently sloping to undulating | 08 to 18% – Undulating to rolling | 18 to 30% – Rolling to moderately steep | 30 to 50% – Steep | Over 50% – Very steep | ||||||
| Hectares | Hectares | Percentage | Hectares | Percentage | Hectares | Percentage | Hectares | Percentage | Hectares | Percentage | Hectares | Percentage | |
| Abaca | 944.471 | 436.016 | 46.17% | 61.04 | 6.46% | 431.325 | 45.67% | 0.816 | 0.09% | 3.046 | 0.32% | 12.228 | 1.30% |
| Abad Santos | 232.914 | 12.932 | 5.55% | 85.224 | 36.59% | 102.576 | 44.04% | 32.182 | 13.82% | ||||
| Aguipo | 442.045 | 209.017 | 47.28% | 71.241 | 16.12% | 77.332 | 17.49% | 18.996 | 4.30% | 65.458 | 14.81% | ||
| Baybayon | 185.445 | 21.451 | 11.57% | 78.525 | 42.34% | 13.17 | 7.10% | 72.3 | 38.99% | ||||
| Bulawan | 126.765 | 9.44 | 7.45% | 40.421 | 31.89% | 40.237 | 31.74% | 2.912 | 2.30% | 33.756 | 26.63% | ||
| Cabidian | 313.637 | 123.508 | 39.38% | 3.268 | 1.04% | 79.437 | 25.33% | 97.639 | 31.13% | 9.785 | 3.12% | ||
| Cawayanan | 377.966 | 157.022 | 41.54% | 40.95 | 10.83% | 18.786 | 4.97% | 13.5 | 3.57% | 147.709 | 39.08% | ||
| Concepcion | 219.29 | 74.383 | 33.92% | 16.753 | 7.64% | 29.023 | 13.24% | 99.131 | 45.21% | ||||
| Del Mar | 286.973 | 117.004 | 40.77% | 133.986 | 46.69% | 35.984 | 12.54% | ||||||
| Lungsoda-an | 241.967 | 42.133 | 17.41% | 60.147 | 24.86% | 109.873 | 45.41% | 29.814 | 12.32% | ||||
| Marcelo | 218.321 | 55.593 | 25.46% | 3.631 | 1.66% | 46.317 | 21.22% | 112.78 | 51.66% | ||||
| Minol | 284.162 | 105.148 | 37.00% | 78.42 | 27.60% | 0.324 | 0.11% | 22.398 | 7.88% | 77.873 | 27.40% | ||
| Paraiso | 388.851 | 291.061 | 74.85% | 42.01 | 10.80% | 55.779 | 14.35% | ||||||
| Poblacion I | 181.389 | 100.182 | 55.23% | 31.943 | 17.61% | 49.264 | 27.16% | ||||||
| Poblacion II | 519.893 | 263.324 | 50.65% | 75.456 | 14.51% | 49.647 | 9.55% | 131.466 | 25.29% | ||||
| San Isidro | 733.392 | 170.755 | 23.28% | 144.753 | 19.74% | 319.571 | 43.57% | 46.624 | 6.36% | 51.688 | 7.05% | ||
| San Jose | 834.795 | 174.282 | 20.88% | 184.87 | 22.15% | 322.136 | 38.59% | 20.53 | 2.46% | 132.977 | 15.93% | ||
| San Rafael | 149.486 | 131.131 | 87.72% | 0.262 | 0.18% | 8.459 | 5.66% | 9.634 | 6.45% | ||||
| San Roque | 1,376.05 | 466.03 | 33.87% | 241.6 | 17.56% | 263.729 | 19.17% | 216.466 | 15.73% | 65.087 | 4.73% | 123.132 | 8.95% |
| Tambo | 303.148 | 63.664 | 21.00% | 57.288 | 18.90% | 14.167 | 4.67% | 46.936 | 15.48% | 121.092 | 39.95% | ||
| Tangkigan | 423.821 | 134.66 | 31.77% | 67.578 | 15.95% | 52.216 | 12.32% | 65.487 | 15.45% | 103.88 | 24.51% | ||
| Valaga | 135.718 | 47.261 | 34.82% | 38.494 | 28.36% | 49.963 | 36.81% | ||||||
| Sub-Total | 8,920.49 | 3,206.00 | 35.94% | 1,161.48 | 13.02% | 2,129.52 | 23.87% | 912.86 | 10.23% | 1,375.27 | 15.42% | 135.36 | 1.52% |
| Lumislis Island | 114.701 | 114.701 | 100.00% | ||||||||||
| TOTAL | 9,035.19 | 3,320.70 | 36.75% | 1,161.48 | 12.86% | 2,129.52 | 23.57% | 912.86 | 10.10% | 1,375.27 | 15.22% | 135.36 | 1.50% |