
Download in PDF and JPG format
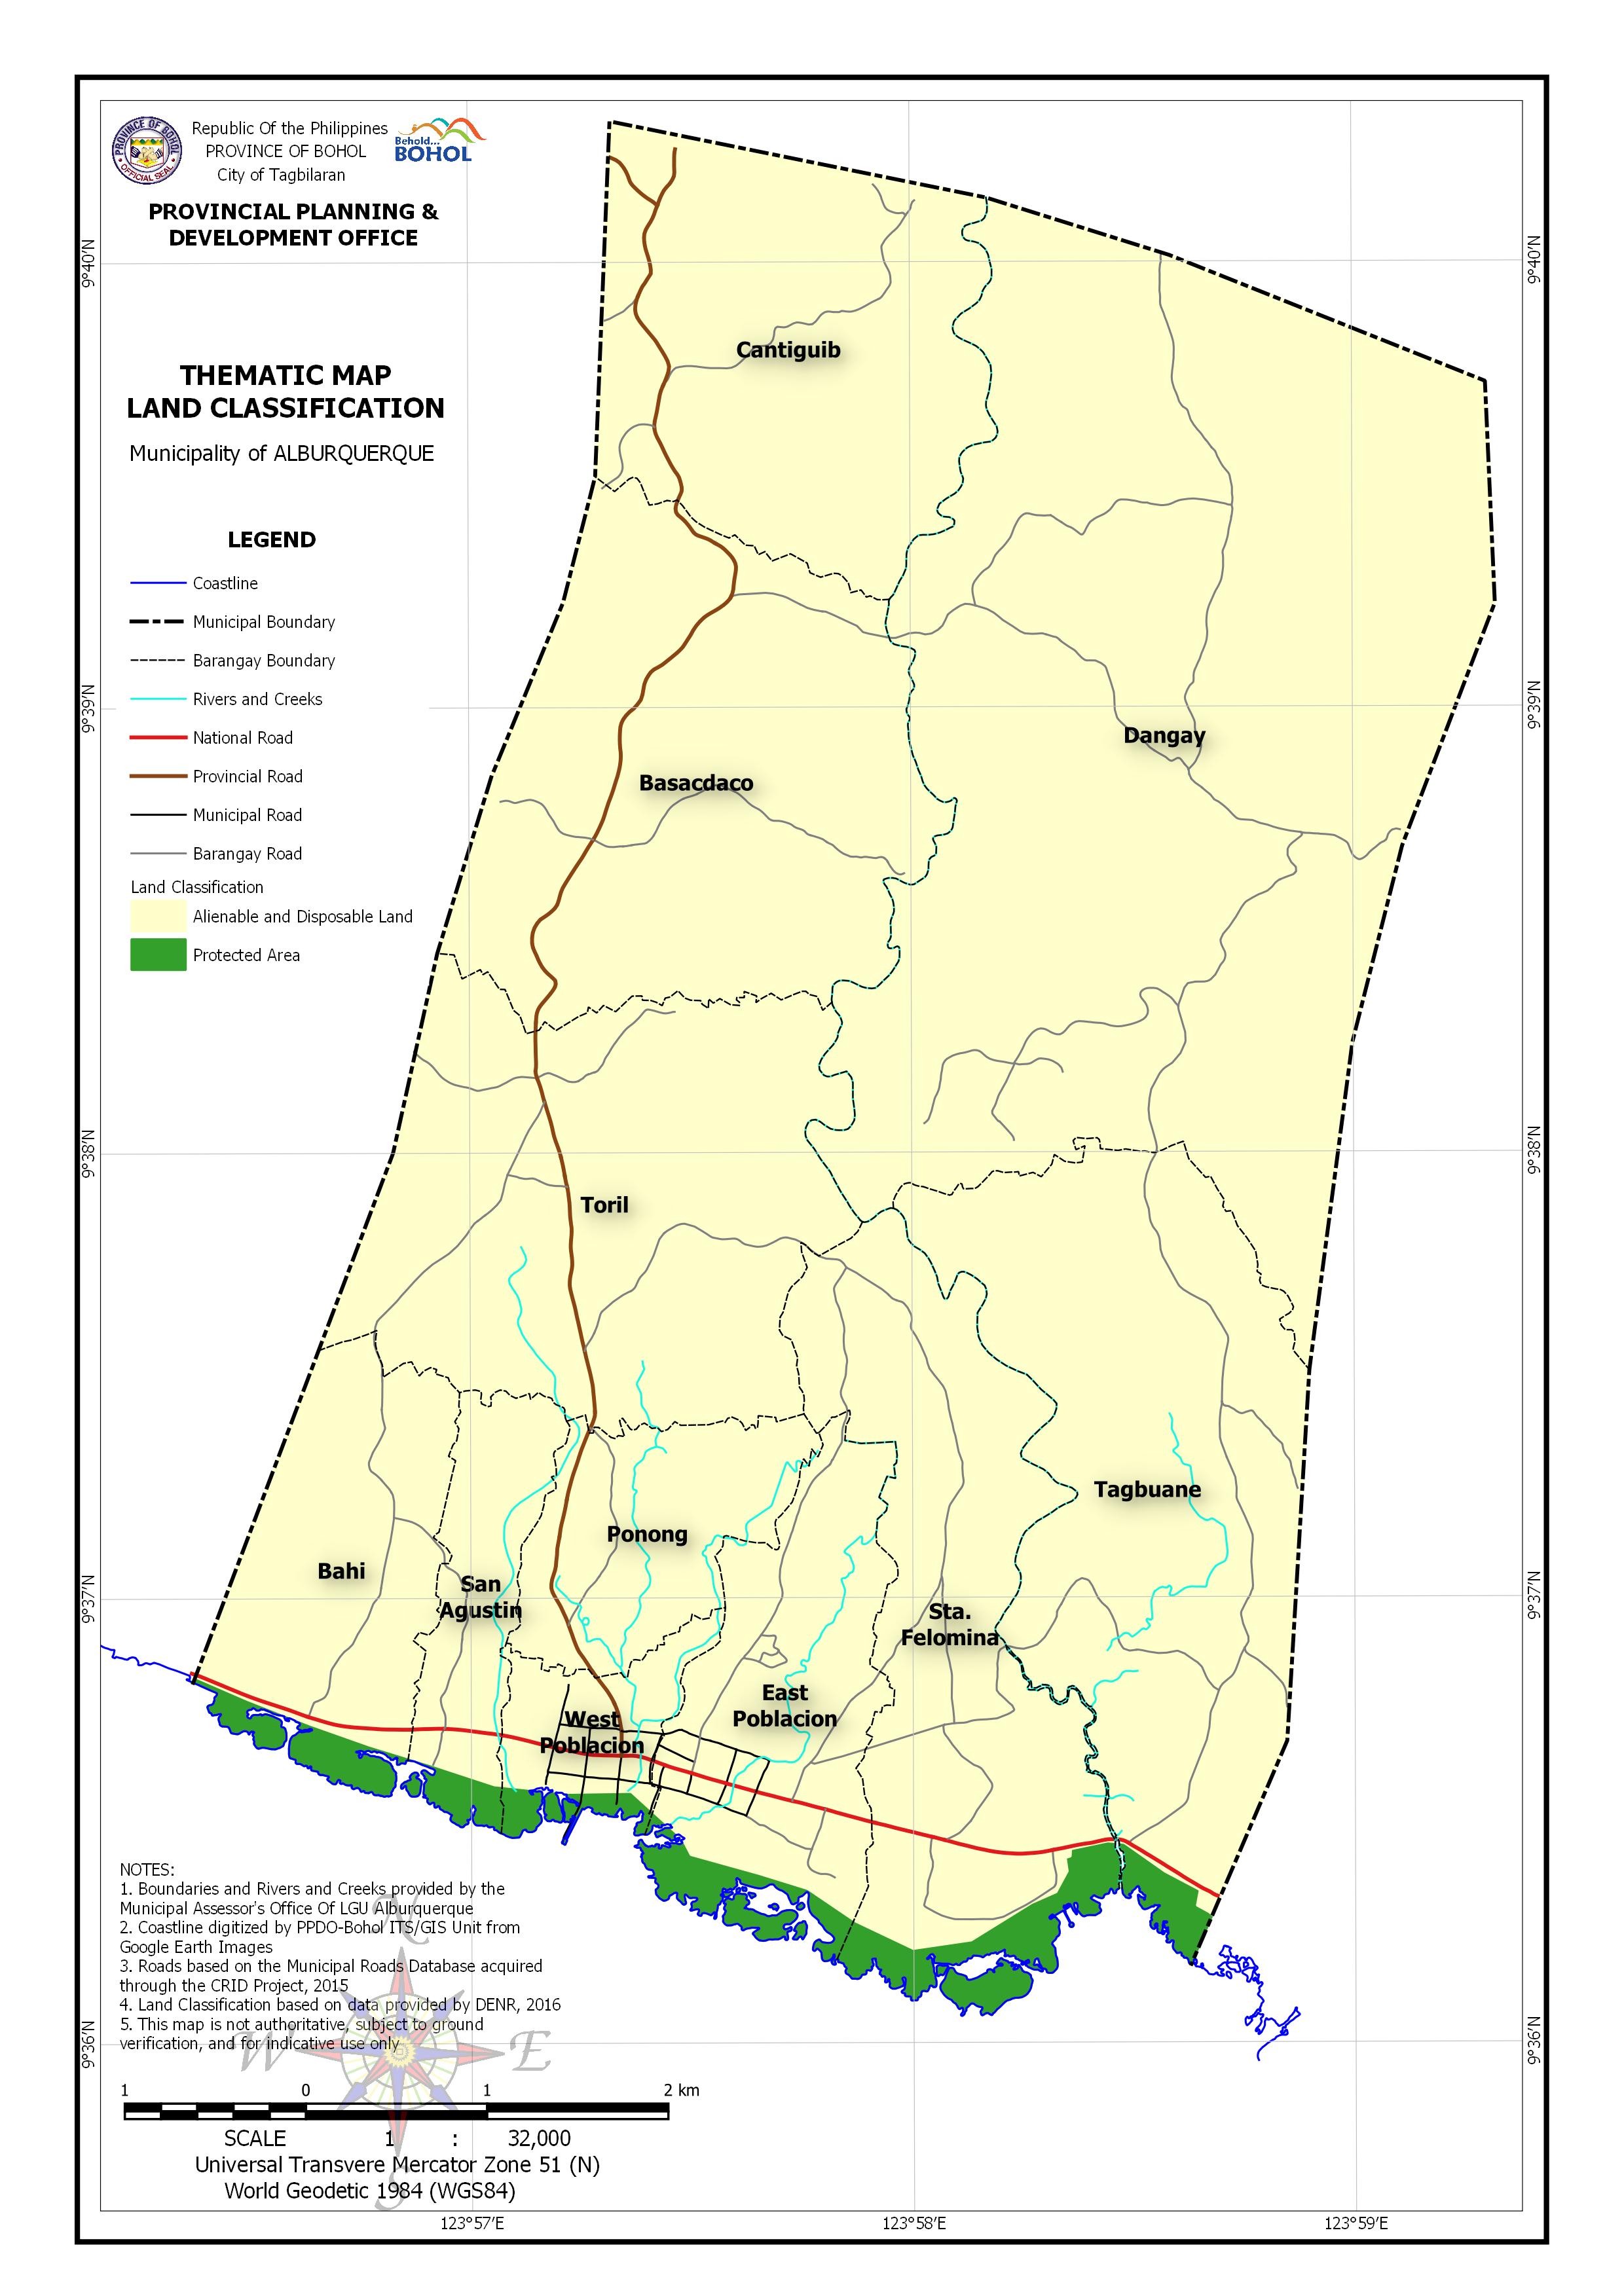
AREA EXPOSED TO LAND CLASSIFICATION BY BARANGAY
| Barangay | Area | Alienable and Disposable Land | Protected Area | No Data | |||
| (Hectares) | (Hectares) | (Percentage) | (Hectares) | (Percentage) | (Hectares) | (Percentage) | |
| Bahi | 131.978 | 119.63 | 90.64% | 12.348 | 9.36% | ||
| Basacdaco | 320.521 | 320.521 | 100.00% | 0.00% | |||
| Cantiguib | 244.97 | 244.97 | 100.00% | 0.00% | |||
| Dangay | 815.135 | 801.145 | 98.28% | 13.99 | 1.72% | ||
| East Poblacion | 141.696 | 126.208 | 89.07% | 15.487 | 10.93% | ||
| Ponong | 89.032 | 89.032 | 100.00% | ||||
| San Agustin | 65.521 | 59.184 | 90.33% | 6.337 | 9.67% | ||
| Sta. Felomina | 242.704 | 216.617 | 89.25% | 26.087 | 10.75% | ||
| Tagbuane | 319.398 | 311.133 | 97.41% | 8.265 | 2.59% | 0.00% | |
| Toril | 308.17 | 154.085 | 50.00% | 154.085 | 50.00% | ||
| West Poblacion | 47.003 | 39.739 | 84.55% | 7.263 | 15.45% | ||
| Total | 2,726.13 | 2,482.26 | 91.06% | 75.787 | 2.78% | 168.075 | 6.17% |