
Download in PDF and JPG format
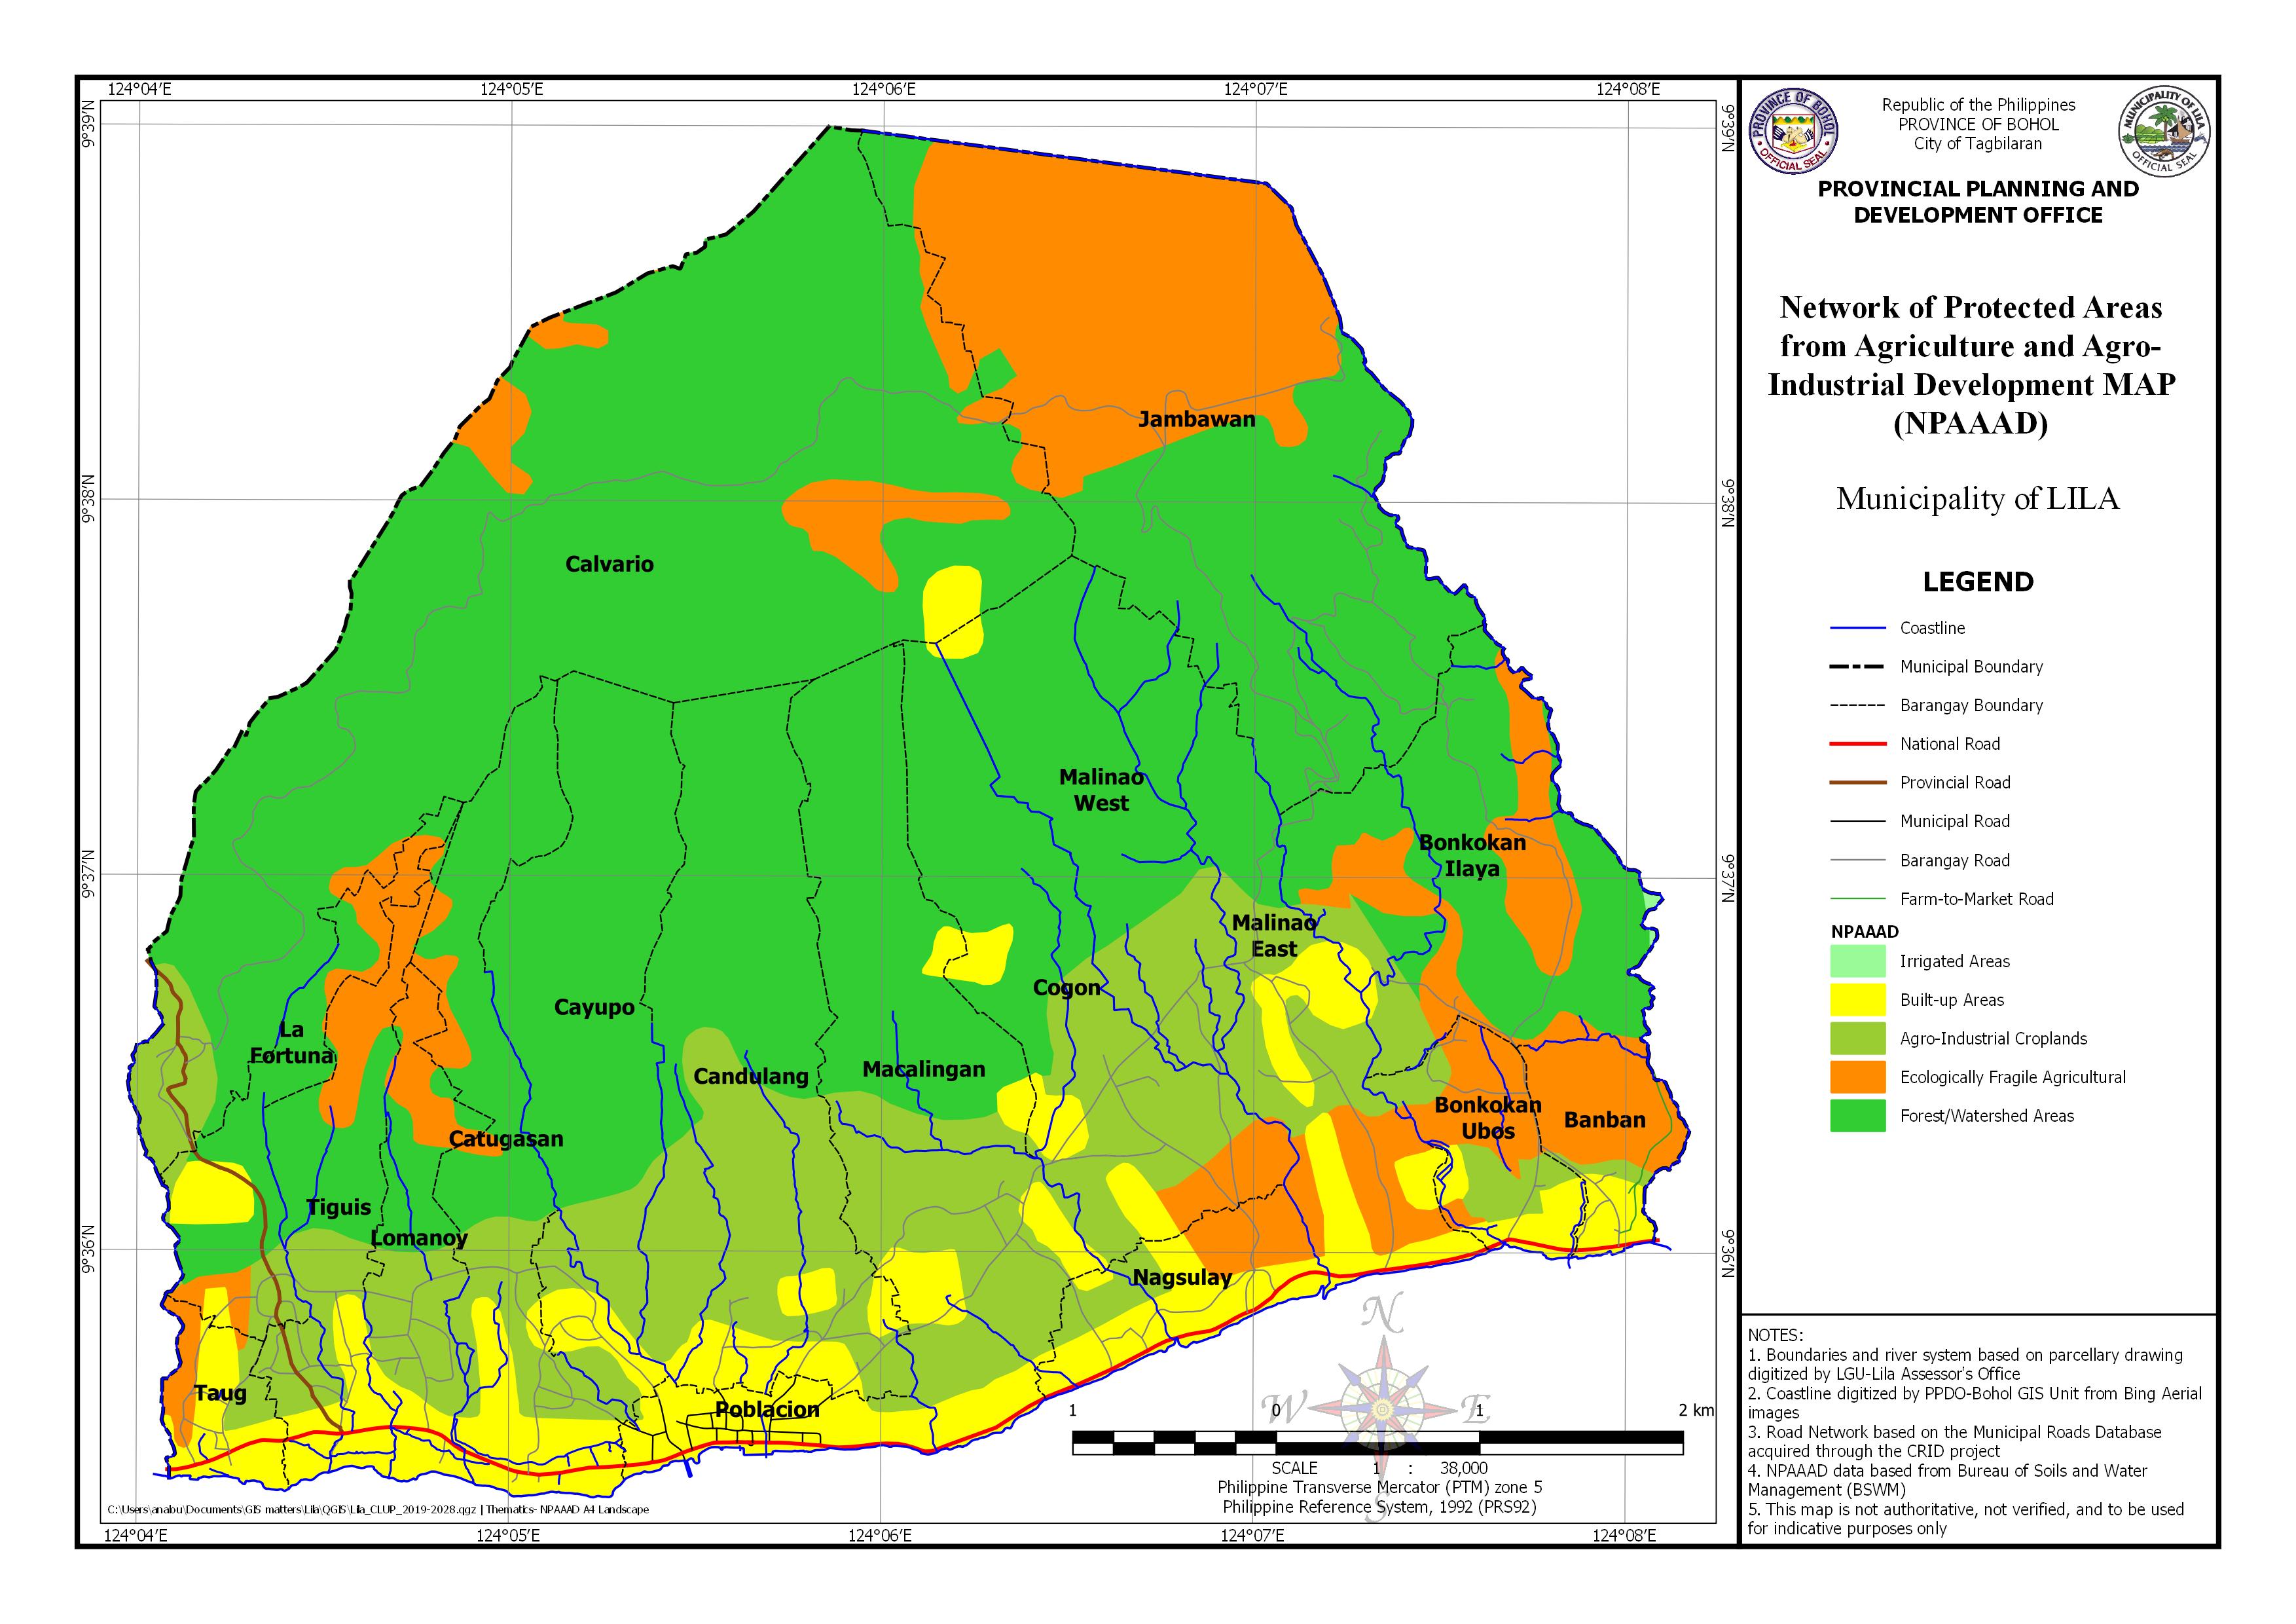
AREA EXPOSED TO NPAAAD BY BARANGAY
| Barangay | Area | Agro-industrial croplands or lands presently planted to industrial crops that support the viability of existing agricultural infrastructure and agro-based enterprises | All agricultural lands that are ecologically fragile, the conversion of which to non agricultural uses will result to serious environmental degredation, mangrove anf fish sanctuaries | All irrigated lands | Built-up areas | Forest/Watershed areas | |||||
| (Hectares) | (Hectares) | Percentage | (Hectares) | Percentage | (Hectares) | Percentage | (Hectares) | Percentage | (Hectares) | Percentage | |
| Banban | 54.651 | 3.769 | 6.90% | 39.301 | 71.91% | 11.581 | 21.19% | ||||
| Bonkokan Ilaya | 235.481 | 18.458 | 7.84% | 69.310 | 29.43% | 1.102 | 0.47% | 3.701 | 1.57% | 142.912 | 60.69% |
| Bonkokan Ubos | 66.327 | 19.572 | 29.51% | 30.625 | 46.17% | 16.130 | 24.32% | ||||
| Calvario | 806.148 | 28.529 | 3.54% | 65.238 | 8.09% | 8.914 | 1.11% | 703.470 | 87.26% | ||
| Candulang | 293.490 | 125.221 | 42.67% | 33.294 | 11.34% | 134.975 | 45.99% | ||||
| Catugasan | 171.121 | 36.702 | 21.45% | 11.501 | 6.72% | 39.408 | 23.03% | 83.511 | 48.80% | ||
| Cayupo | 217.302 | 33.672 | 15.50% | 14.853 | 6.84% | 168.777 | 77.67% | ||||
| Cogon | 207.025 | 72.920 | 35.22% | 17.825 | 8.61% | 24.324 | 11.75% | 91.957 | 44.42% | ||
| Jambawan | 499.561 | 243.399 | 48.72% | 0.00% | 256.166 | 51.28% | |||||
| La Fortuna | 90.095 | 10.789 | 11.98% | 18.787 | 20.85% | 14.333 | 15.91% | 46.185 | 51.26% | ||
| Lomanoy | 85.477 | 32.418 | 37.93% | 18.139 | 21.22% | 13.702 | 16.03% | 21.218 | 24.82% | ||
| Macalingan | 283.497 | 104.137 | 36.73% | 42.309 | 14.92% | 137.051 | 48.34% | ||||
| Malinao East | 194.783 | 44.946 | 23.08% | 28.843 | 14.81% | 47.253 | 24.26% | 73.748 | 37.86% | ||
| Malinao West | 150.937 | 43.361 | 28.73% | 3.235 | 2.14% | 104.341 | 69.13% | ||||
| Nagsulay | 70.907 | 12.954 | 18.27% | 18.605 | 26.24% | 39.348 | 55.49% | ||||
| Poblacion | 47.646 | 2.480 | 5.21% | 45.165 | 94.79% | ||||||
| Taug | 39.564 | 6.879 | 17.39% | 9.633 | 24.35% | 23.052 | 58.27% | ||||
| Tiguis | 119.020 | 30.954 | 26.01% | 24.392 | 20.49% | 24.736 | 20.78% | 38.937 | 32.72% | ||
| Total | 3633.033 | 627.761 | 367.92% | 595.598 | 347.63% | 1.102 | 0.47% | 405.339 | 403.75% | 2003.248 | 680.24% |