
Download in PDF and JPG format
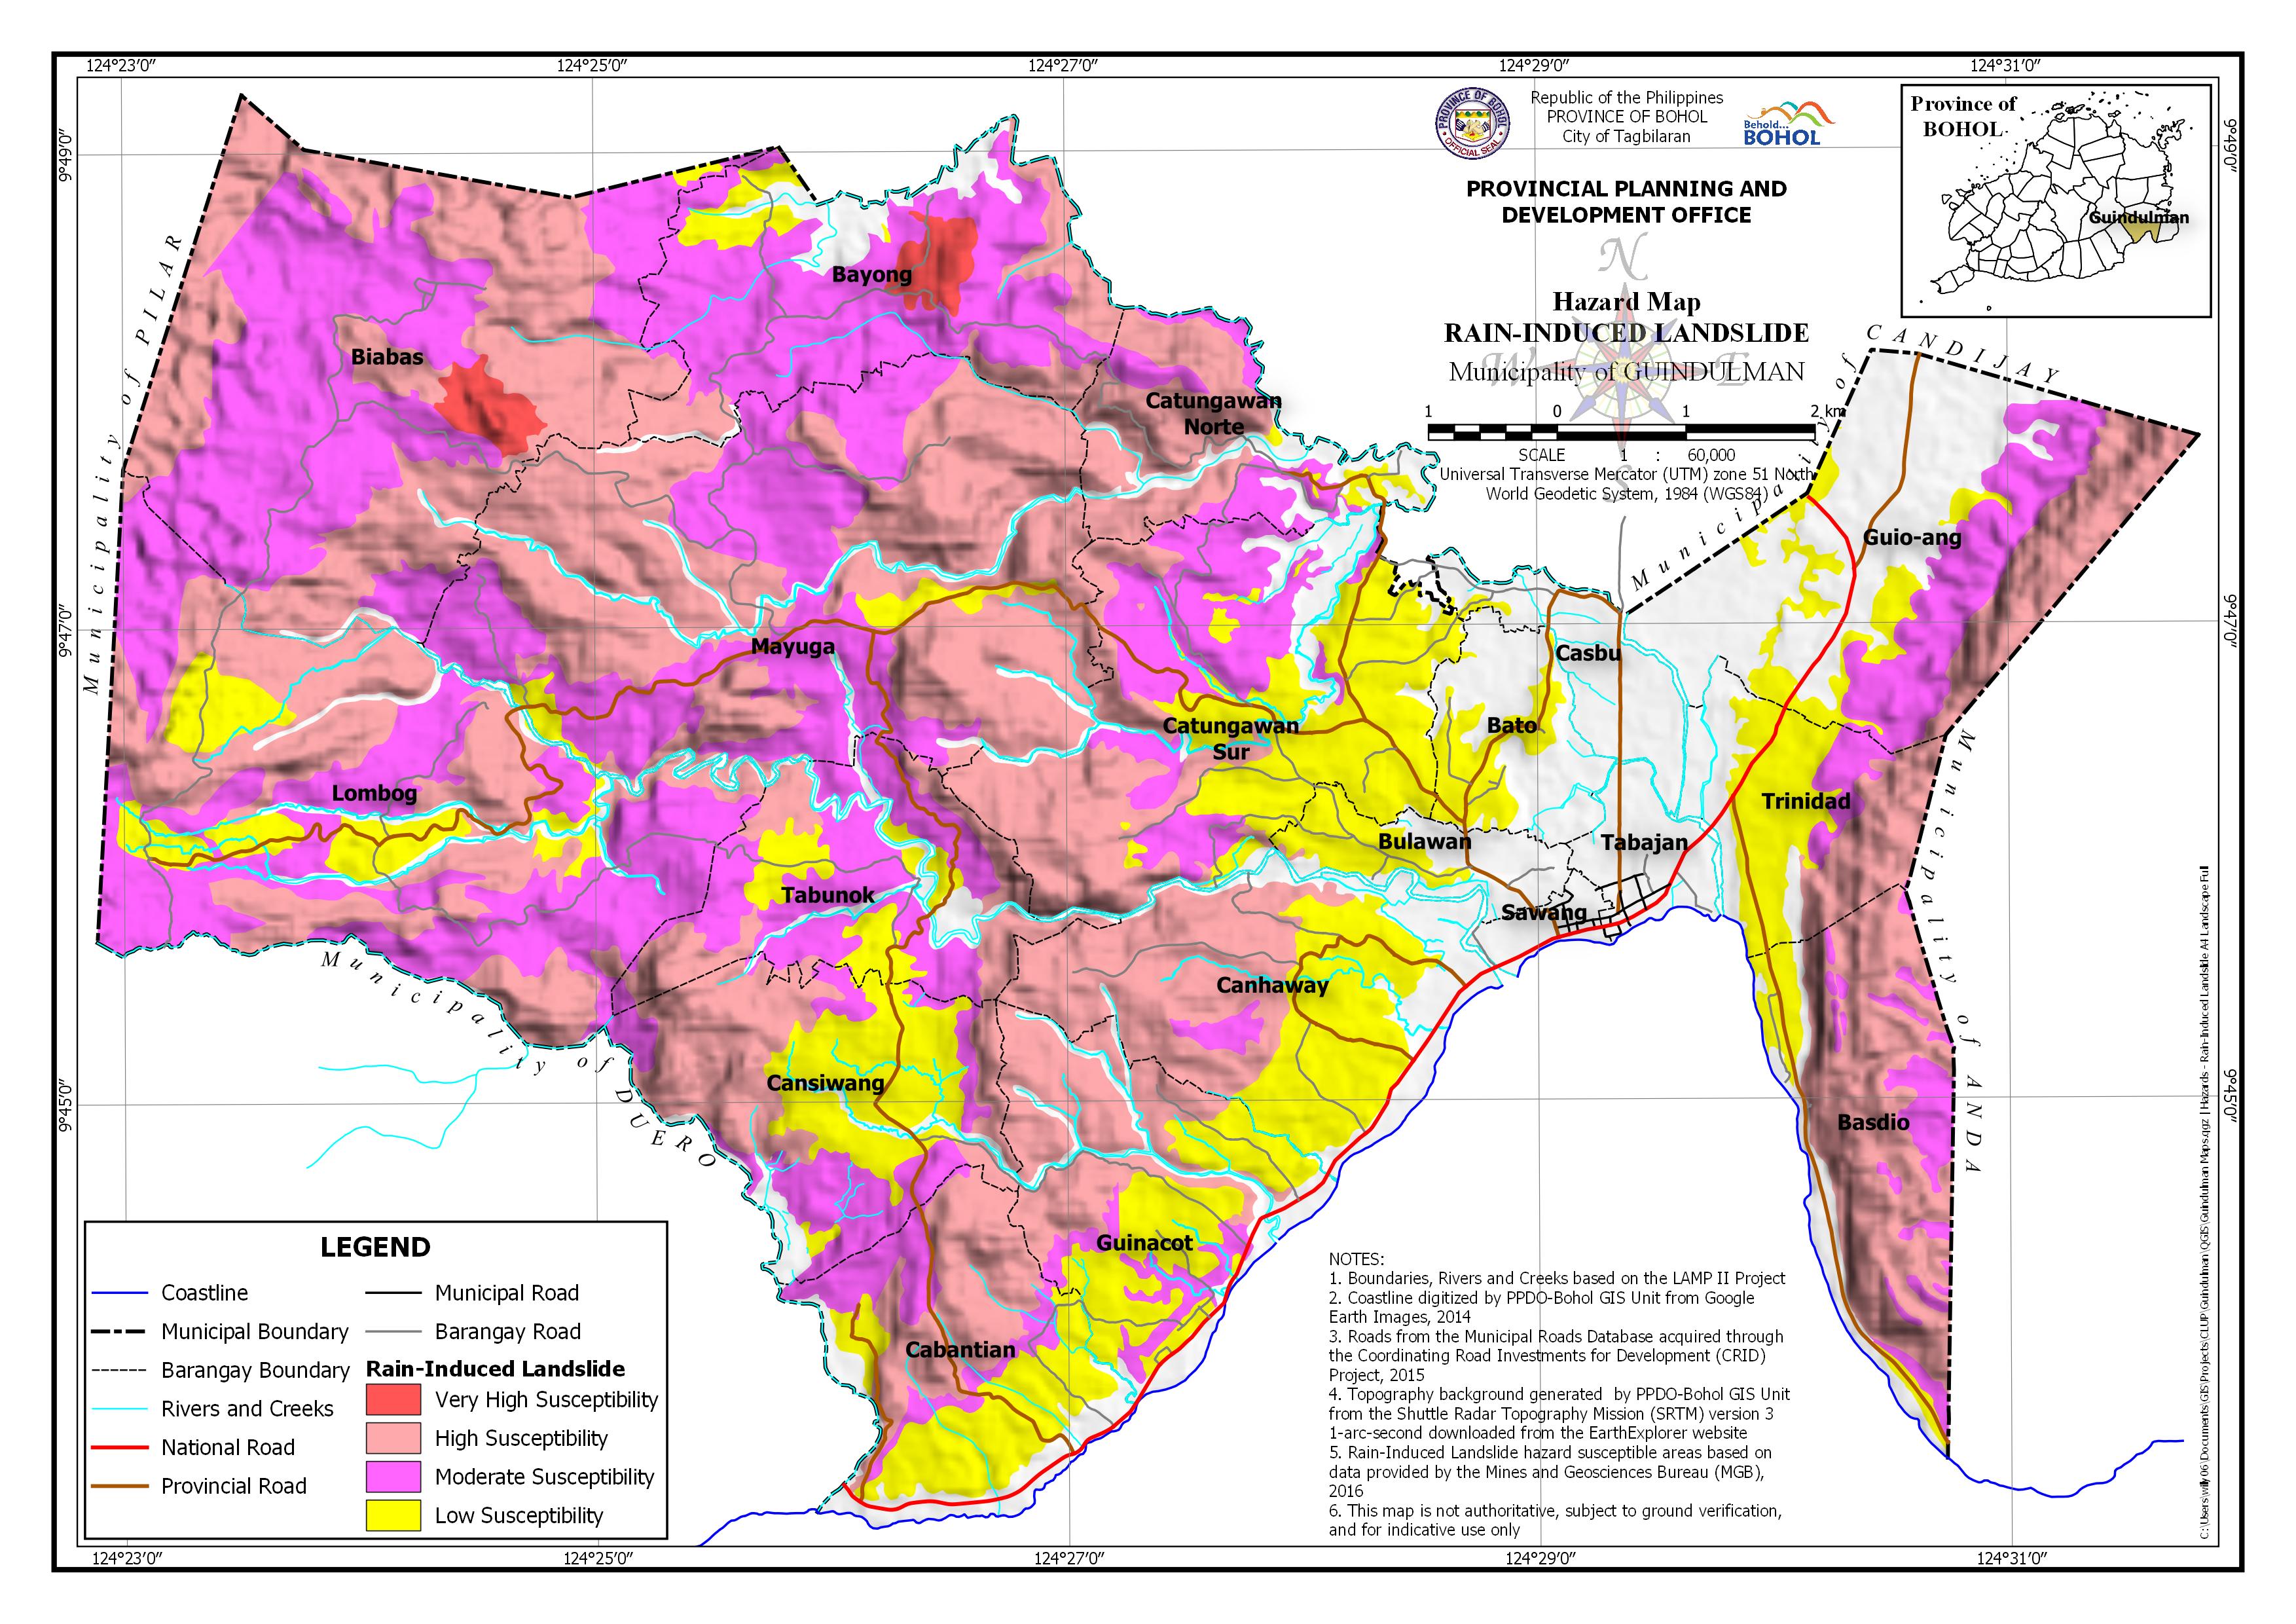
AREA EXPOSED TO RAIN-INDUCED LANDSLIDE HAZARD BY BARANGAY
| Barangay | Area | Barangay Area Exposed to Very High Susceptibility | Barangay Area Exposed to High Susceptibility | Barangay Area Exposed to Moderate Susceptibility | Barangay Area Exposed to Low Susceptibility | ||||
| Hectares | Hectares | Percentage | Hectares | Percentage | Hectares | Percentage | Hectares | Percentage | |
| Basdio | 423.159 | 277.898 | 65.67% | 61.152 | 14.45% | 36.25 | 8.57% | ||
| Bato | 180.858 | 64.689 | 35.77% | ||||||
| Bayong | 575.094 | 35.294 | 6.14% | 101.14 | 17.59% | 347.236 | 60.38% | 32.908 | 5.72% |
| Biabas | 1,151.05 | 34.082 | 2.96% | 549.67 | 47.75% | 557.35 | 48.42% | 3.515 | 0.31% |
| Bulawan | 118.372 | 1.009 | 0.85% | 51.691 | 43.67% | ||||
| Cabantian | 438.102 | 150.033 | 34.25% | 73.001 | 16.66% | 142.578 | 32.54% | ||
| Canhaway | 527.07 | 234.242 | 44.44% | 13.334 | 2.53% | 180.643 | 34.27% | ||
| Cansiwang | 485.754 | 177.425 | 36.53% | 116.504 | 23.98% | 160.788 | 33.10% | ||
| Casbu | 132.375 | 4.271 | 3.23% | ||||||
| Catungawan Norte | 292.09 | 164.255 | 56.23% | 60.41 | 20.68% | 13.647 | 4.67% | ||
| Catungawan Sur | 751.384 | 214.719 | 28.58% | 205.202 | 27.31% | 267.841 | 35.65% | ||
| Guinacot | 438.701 | 182.9 | 41.69% | 42.608 | 9.71% | 155.875 | 35.53% | ||
| Guio-ang | 716.046 | 135.98 | 18.99% | 161.104 | 22.50% | 78.022 | 10.90% | ||
| Lombog | 1,119.95 | 452.221 | 40.38% | 496.537 | 44.34% | 137.784 | 12.30% | ||
| Mayuga | 1,266.42 | 760.181 | 60.03% | 428.871 | 33.87% | 37.481 | 2.96% | ||
| Sawang | 40.313 | ||||||||
| Tabajan | 94.106 | ||||||||
| Tabunok | 398.162 | 112.168 | 28.17% | 192.193 | 48.27% | 63.517 | 15.95% | ||
| Trinidad | 277.31 | 82.879 | 29.89% | 27.596 | 9.95% | 107.91 | 38.91% | ||
| TOTAL | 9,426.31 | 69.376 | 0.74% | 3,596.72 | 38.16% | 2,783.10 | 29.53% | 1,539.41 | 16.33% |