
Download in PDF and JPG format
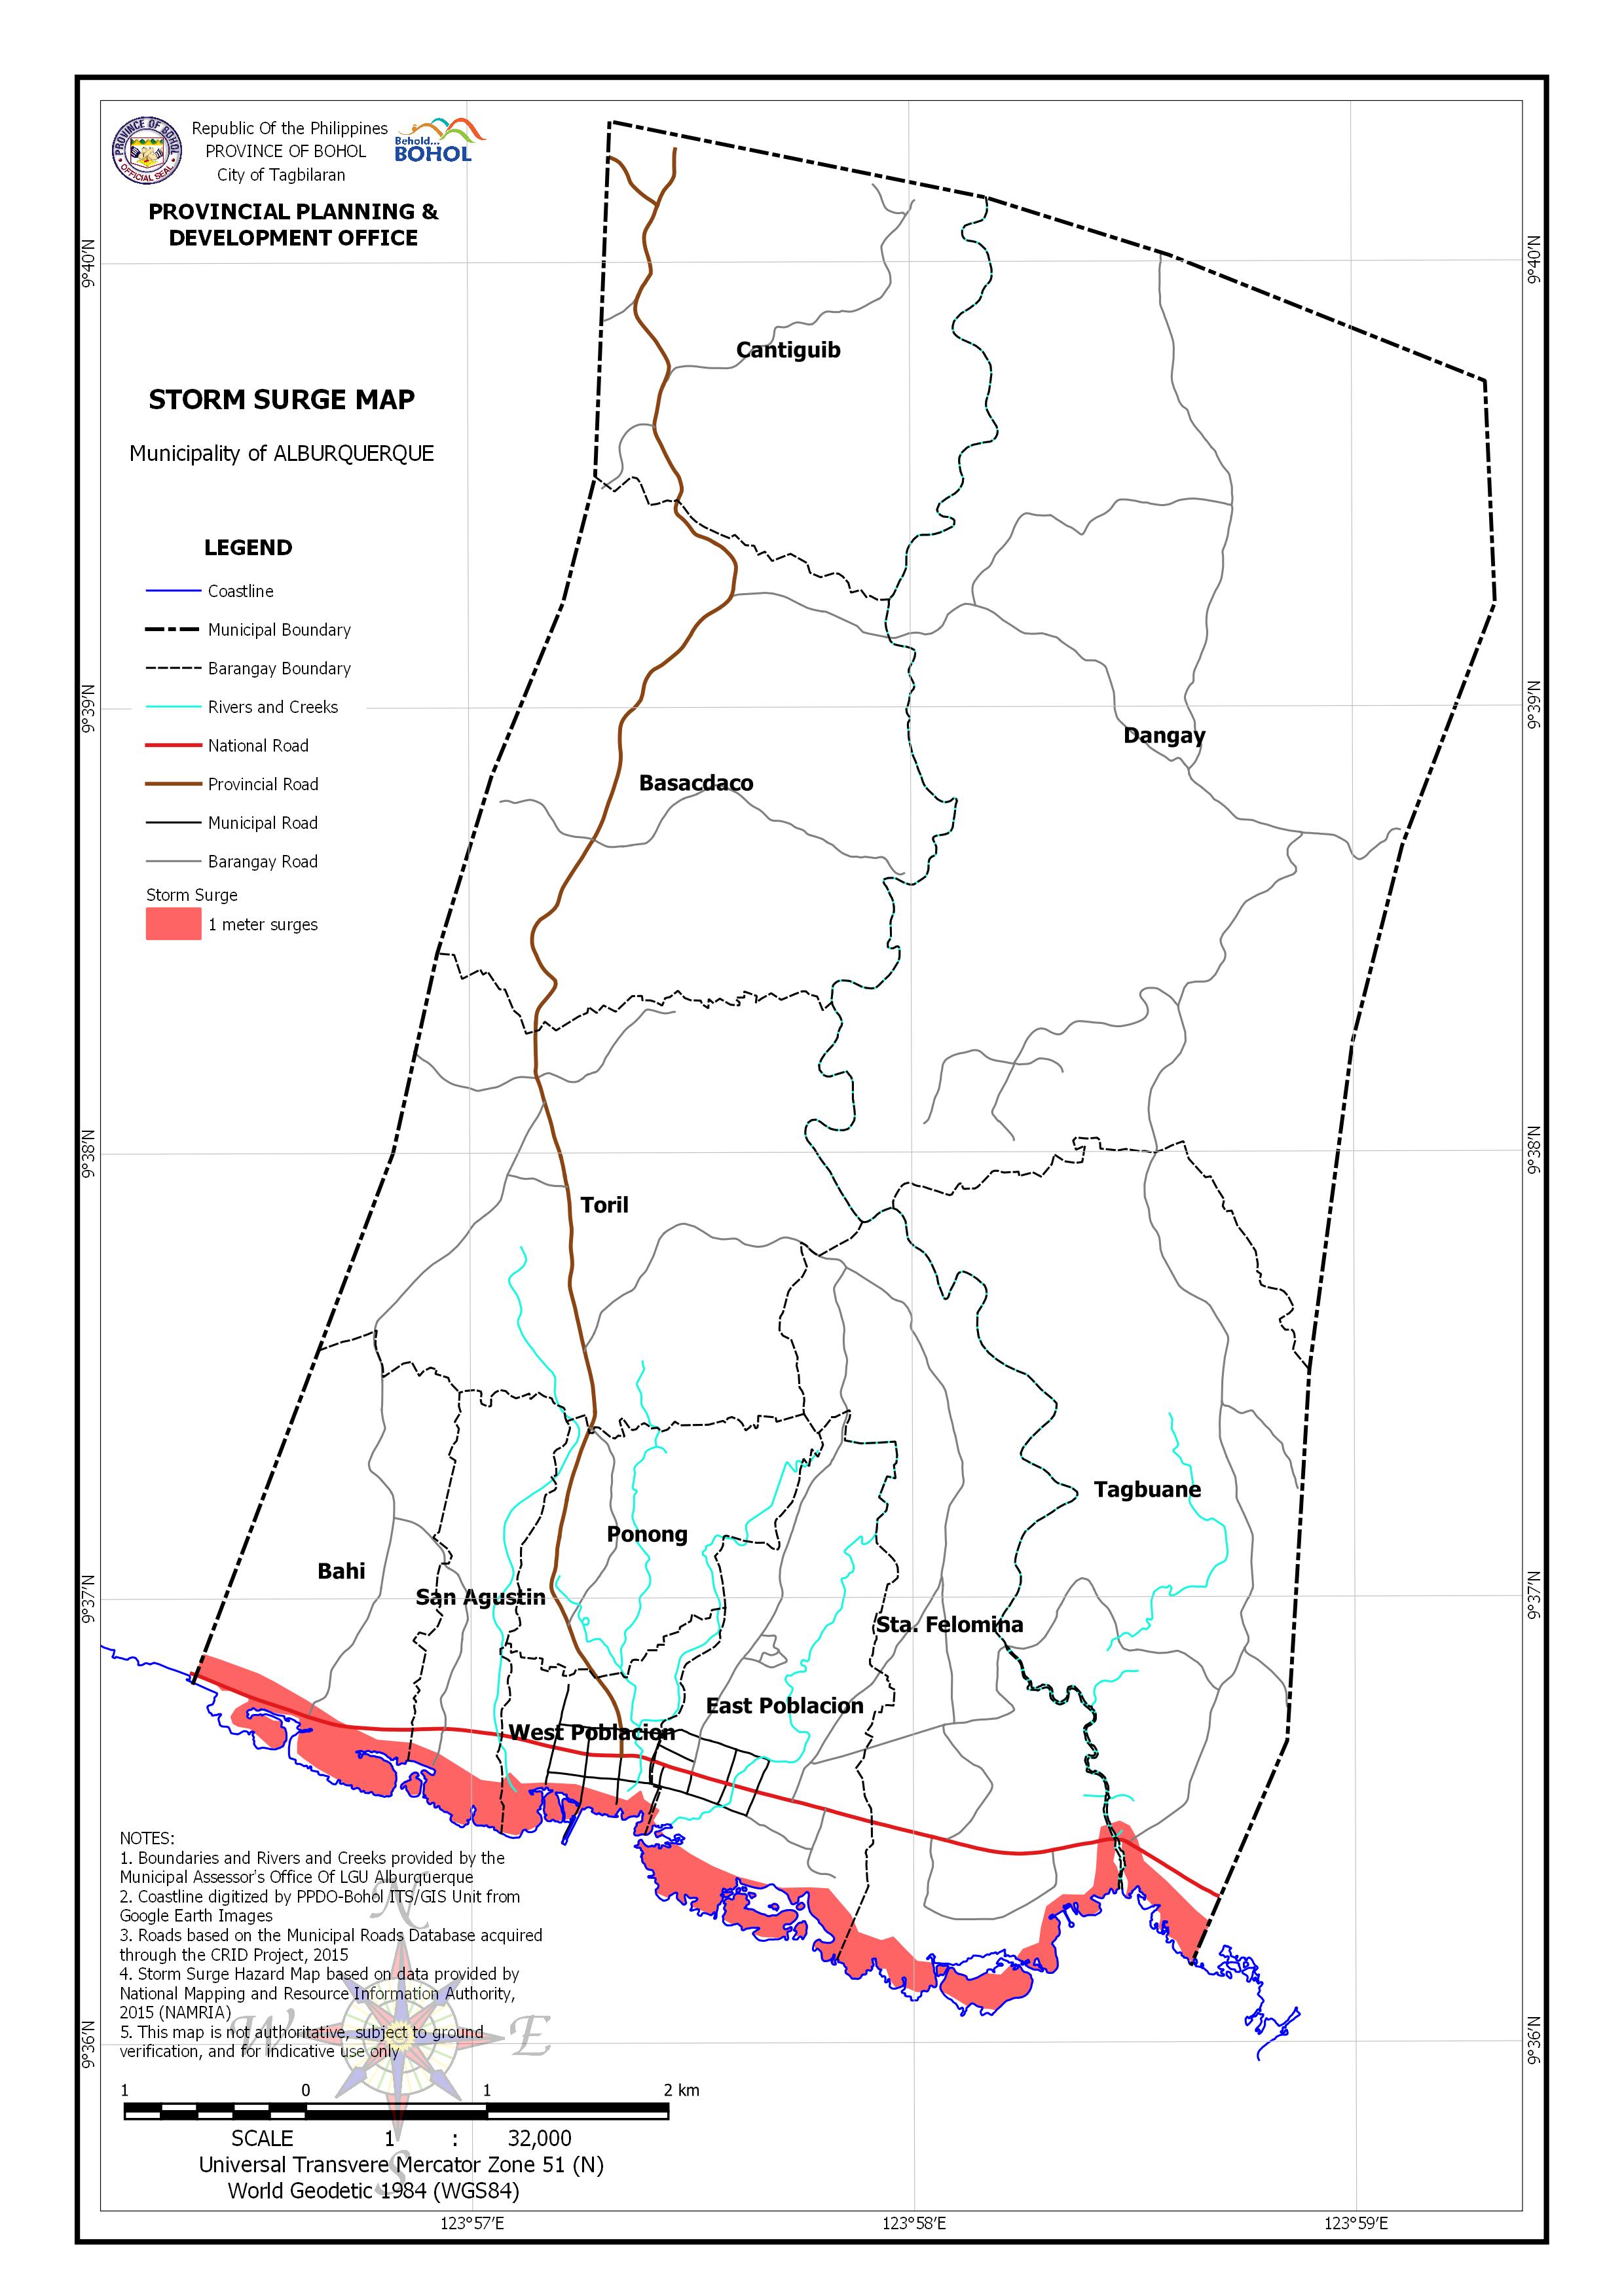
AREA EXPOSED TO STORM SURGE HAZARD BY BARANGAY
| Barangay | Area | Area Exposed to Over 1 meter Inundation | |
| (Hectares) | (Hectares) | (Percentage) | |
| Bahi | 131.978 | 15.681 | 11.88% |
| Basacdaco | 320.521 | ||
| Cantiguib | 244.97 | ||
| Dangay | 815.135 | ||
| East Poblacion | 141.696 | 13.691 | 9.66% |
| Ponong | 89.032 | ||
| San Agustin | 65.521 | 7.381 | 11.27% |
| Sta. Felomina | 242.704 | 15.442 | 6.36% |
| Tagbuane | 319.398 | 6.446 | 2.02% |
| Toril | 308.17 | ||
| West Poblacion | 47.003 | 7.641 | 16.26% |
| Total | 2,726.13 | 66.283 | 2.43% |