
Download in PDF and JPG format
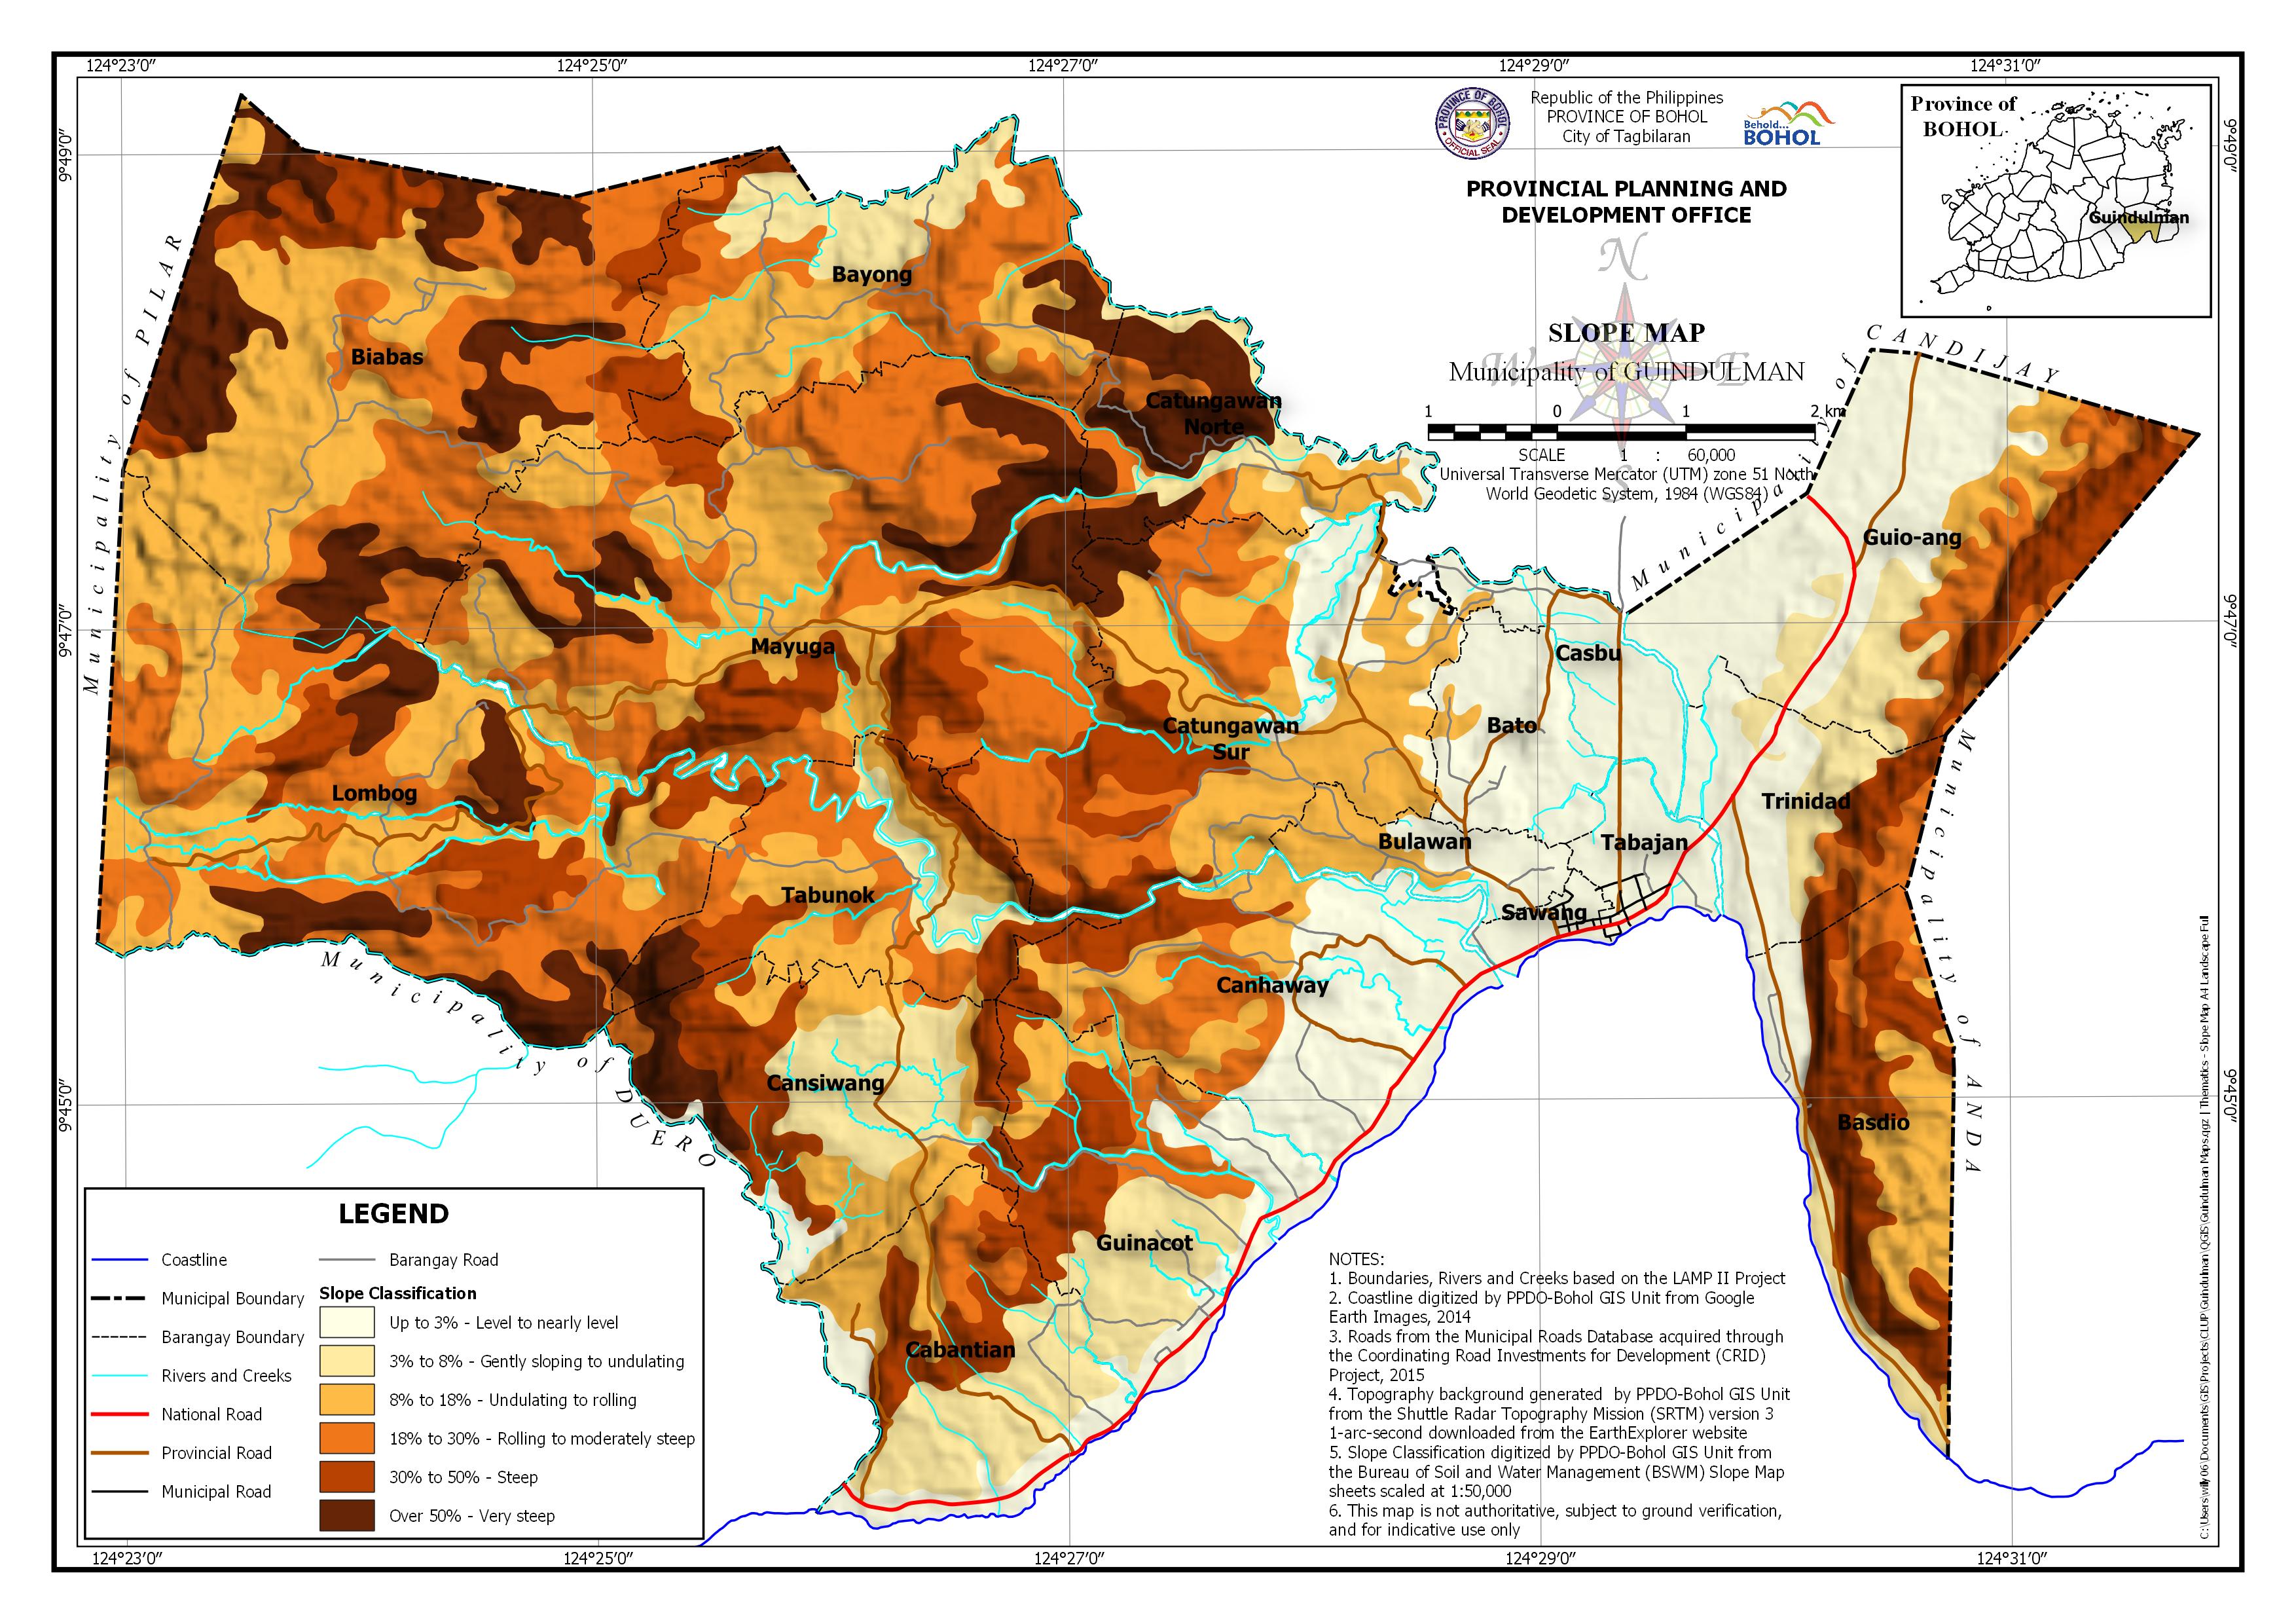
AREA PER SLOPE CLASSIFICATION BY BARANGAY
| Barangay | Area | Up to 3% – Level to nearly level | 3% to 8% – Gently sloping to undulating | 8% to 18% – Undulating to rolling | 18% to 30% – Rolling to moderately steep | 30% to 50% – Steep | Over 50% – Very Steep | ||||||
| Hectares | Hectares | Percentage | Hectares | Percentage | Hectares | Percentage | Hectares | Percentage | Hectares | Percentage | Hectares | Percentage | |
| Basdio | 423.159 | 38.95 | 9.21% | 43.484 | 10.28% | 111.631 | 26.38% | 34.197 | 8.08% | 189.903 | 44.88% | ||
| Bato | 180.858 | 170.453 | 94.25% | 10.405 | 5.75% | ||||||||
| Bayong | 575.094 | 114.523 | 19.91% | 161.257 | 28.04% | 221.12 | 38.45% | 49.601 | 8.63% | 28.593 | 4.97% | ||
| Biabas | 1,151.05 | 367.216 | 31.90% | 358.835 | 31.18% | 120.294 | 10.45% | 304.702 | 26.47% | ||||
| Bulawan | 118.372 | 64.266 | 54.29% | 54.106 | 45.71% | ||||||||
| Cabantian | 438.102 | 75.993 | 17.35% | 158.654 | 36.21% | 62.557 | 14.28% | 40.205 | 9.18% | 95.58 | 21.82% | ||
| Canhaway | 527.07 | 271.252 | 51.46% | 99.69 | 18.91% | 92.577 | 17.56% | 61.527 | 11.67% | ||||
| Cansiwang | 485.754 | 26.597 | 5.48% | 147.094 | 30.28% | 120.62 | 24.83% | 13.424 | 2.76% | 131.176 | 27.01% | 46.843 | 9.64% |
| Casbu | 132.375 | 128.702 | 97.23% | 3.673 | 2.78% | ||||||||
| Catungawan Norte | 292.09 | 16.69 | 5.71% | 42.035 | 14.39% | 50.998 | 17.46% | 46.565 | 15.94% | 135.804 | 46.49% | ||
| Catungawan Sur | 751.384 | 97.665 | 13.00% | 0.025 | 0.00% | 320.789 | 42.69% | 183.796 | 24.46% | 124.673 | 16.59% | 24.435 | 3.25% |
| Guinacot | 438.701 | 102.051 | 23.26% | 125.617 | 28.63% | 40.737 | 9.29% | 54.643 | 12.46% | 111.204 | 25.35% | ||
| Guio-ang | 716.046 | 353.155 | 49.32% | 94.811 | 13.24% | 54.823 | 7.66% | 109.691 | 15.32% | 103.566 | 14.46% | ||
| Lombog | 1,119.95 | 398.147 | 35.55% | 407.513 | 36.39% | 129.815 | 11.59% | 184.478 | 16.47% | ||||
| Mayuga | 1,266.42 | 0.034 | 0.00% | 375.488 | 29.65% | 562.17 | 44.39% | 157.303 | 12.42% | 171.421 | 13.54% | ||
| Sawang | 40.313 | 39.388 | 97.70% | ||||||||||
| Tabajan | 94.106 | 93.649 | 99.52% | ||||||||||
| Tabunok | 398.162 | 46.114 | 11.58% | 128.059 | 32.16% | 117.633 | 29.54% | 82.675 | 20.76% | 23.68 | 5.95% | ||
| Trinidad | 277.31 | 131.314 | 47.35% | 59.386 | 21.42% | 35.306 | 12.73% | 51.207 | 18.47% | ||||
| TOTAL | 9,426.31 | 1,610.12 | 17.08% | 831.779 | 8.82% | 2,360.19 | 25.04% | 2,277.67 | 24.16% | 1,408.52 | 14.94% | 919.957 | 9.76% |