
Download in PDF and JPG format
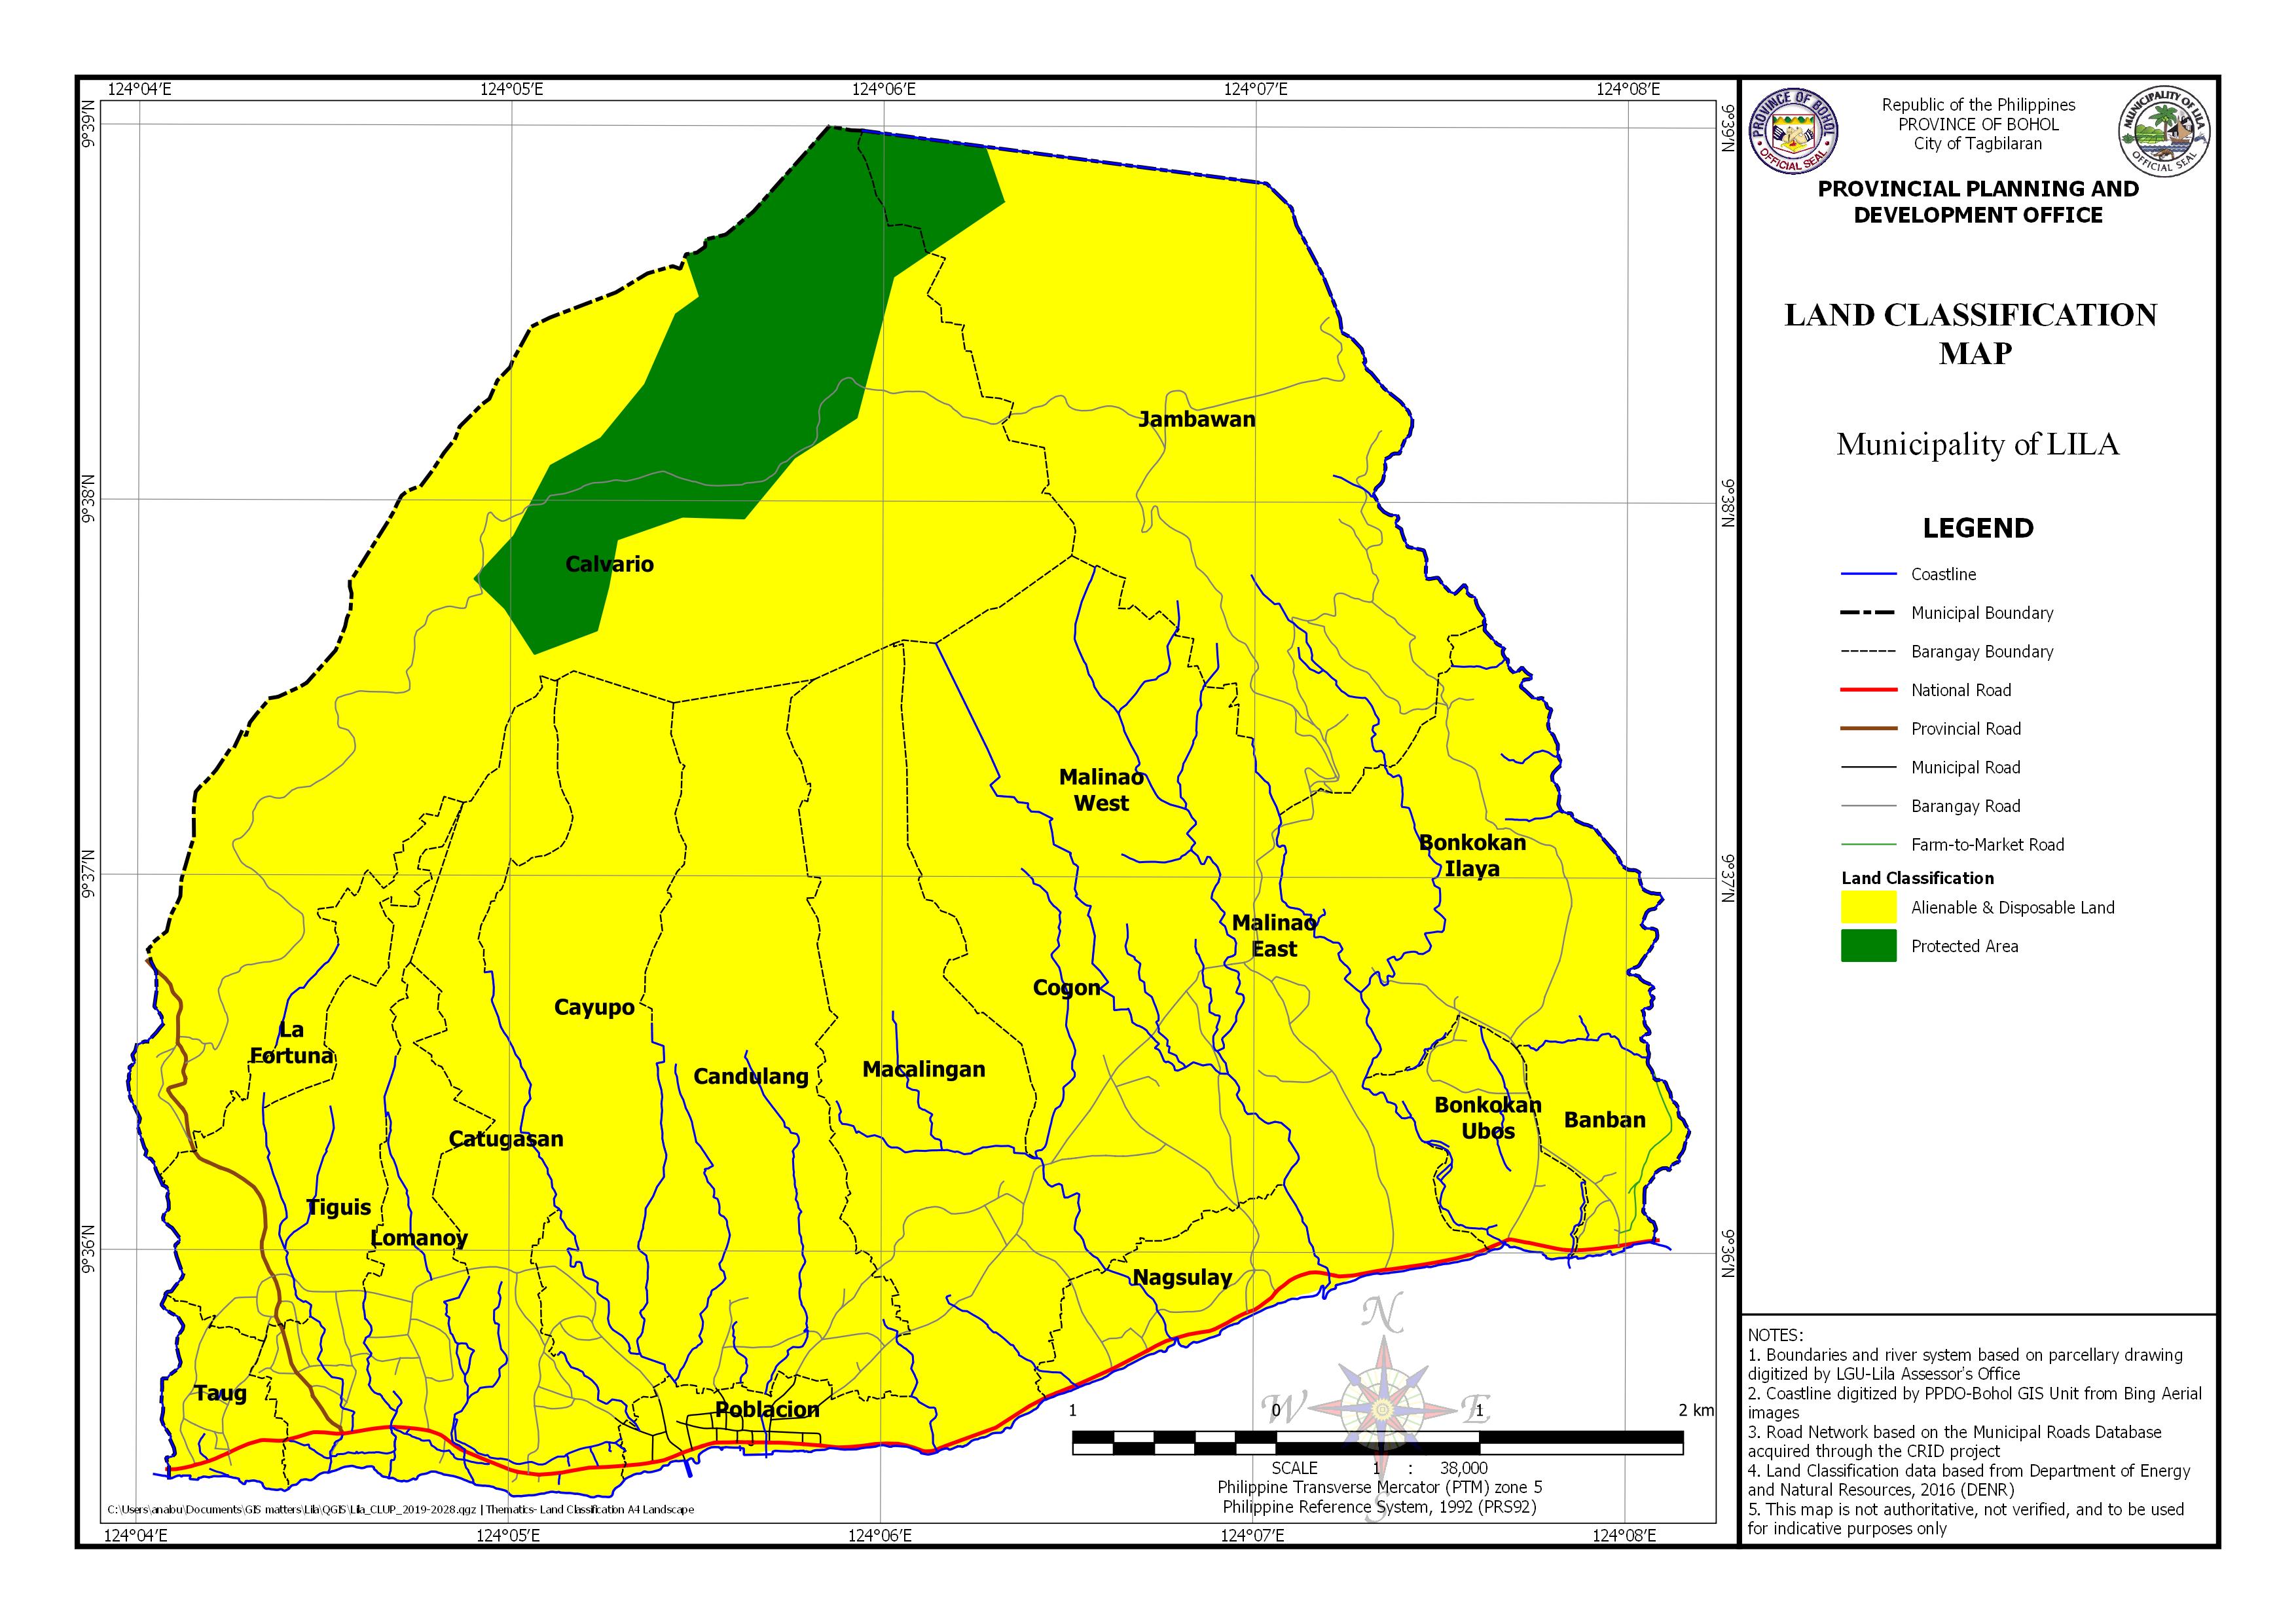
AREA EXPOSED TO LAND CLASSIFICATION BY BARANGAY
| Barangay | Area | Area Exposed to Alien and Disposable Land | Area Exposed to Protected Area | ||
|---|---|---|---|---|---|
| (hectares) | (hectares) | Percentage | (hectares) | Percentage | |
| Banban | 54.651 | 54.532 | 99.783% | ||
| Bonkokan Ilaya | 235.481 | 235.481 | 100.000% | ||
| Bonkokan Ubos | 66.327 | 66.323 | 99.994% | ||
| Calvario | 806.148 | 597.814 | 74.157% | 208.335 | 25.843% |
| Candulang | 293.490 | 293.490 | 100.000% | ||
| Catugasan | 171.121 | 171.049 | 99.958% | ||
| Cayupo | 217.302 | 217.302 | 100.000% | ||
| Cogon | 207.025 | 207.025 | 100.000% | ||
| Jambawan | 499.561 | 472.683 | 94.620% | 26.880 | 5.381% |
| La Fortuna | 90.095 | 90.095 | 100.000% | ||
| Lomanoy | 85.477 | 85.451 | 99.969% | ||
| Macalingan | 283.497 | 283.388 | 99.962% | ||
| Malinao East | 194.783 | 194.247 | 99.725% | ||
| Malinao West | 150.937 | 150.937 | 100.000% | ||
| Nagsulay | 70.907 | 70.415 | 99.307% | ||
| Poblacion | 47.646 | 47.178 | 99.018% | ||
| Taug | 39.564 | 39.530 | 99.913% | ||
| Tiguis | 119.020 | 118.941 | 99.934% | ||
| Total | 3633.033 | 3395.881 | 1766.338% | 235.214 | 31.224% |