
Download in PDF and JPG format
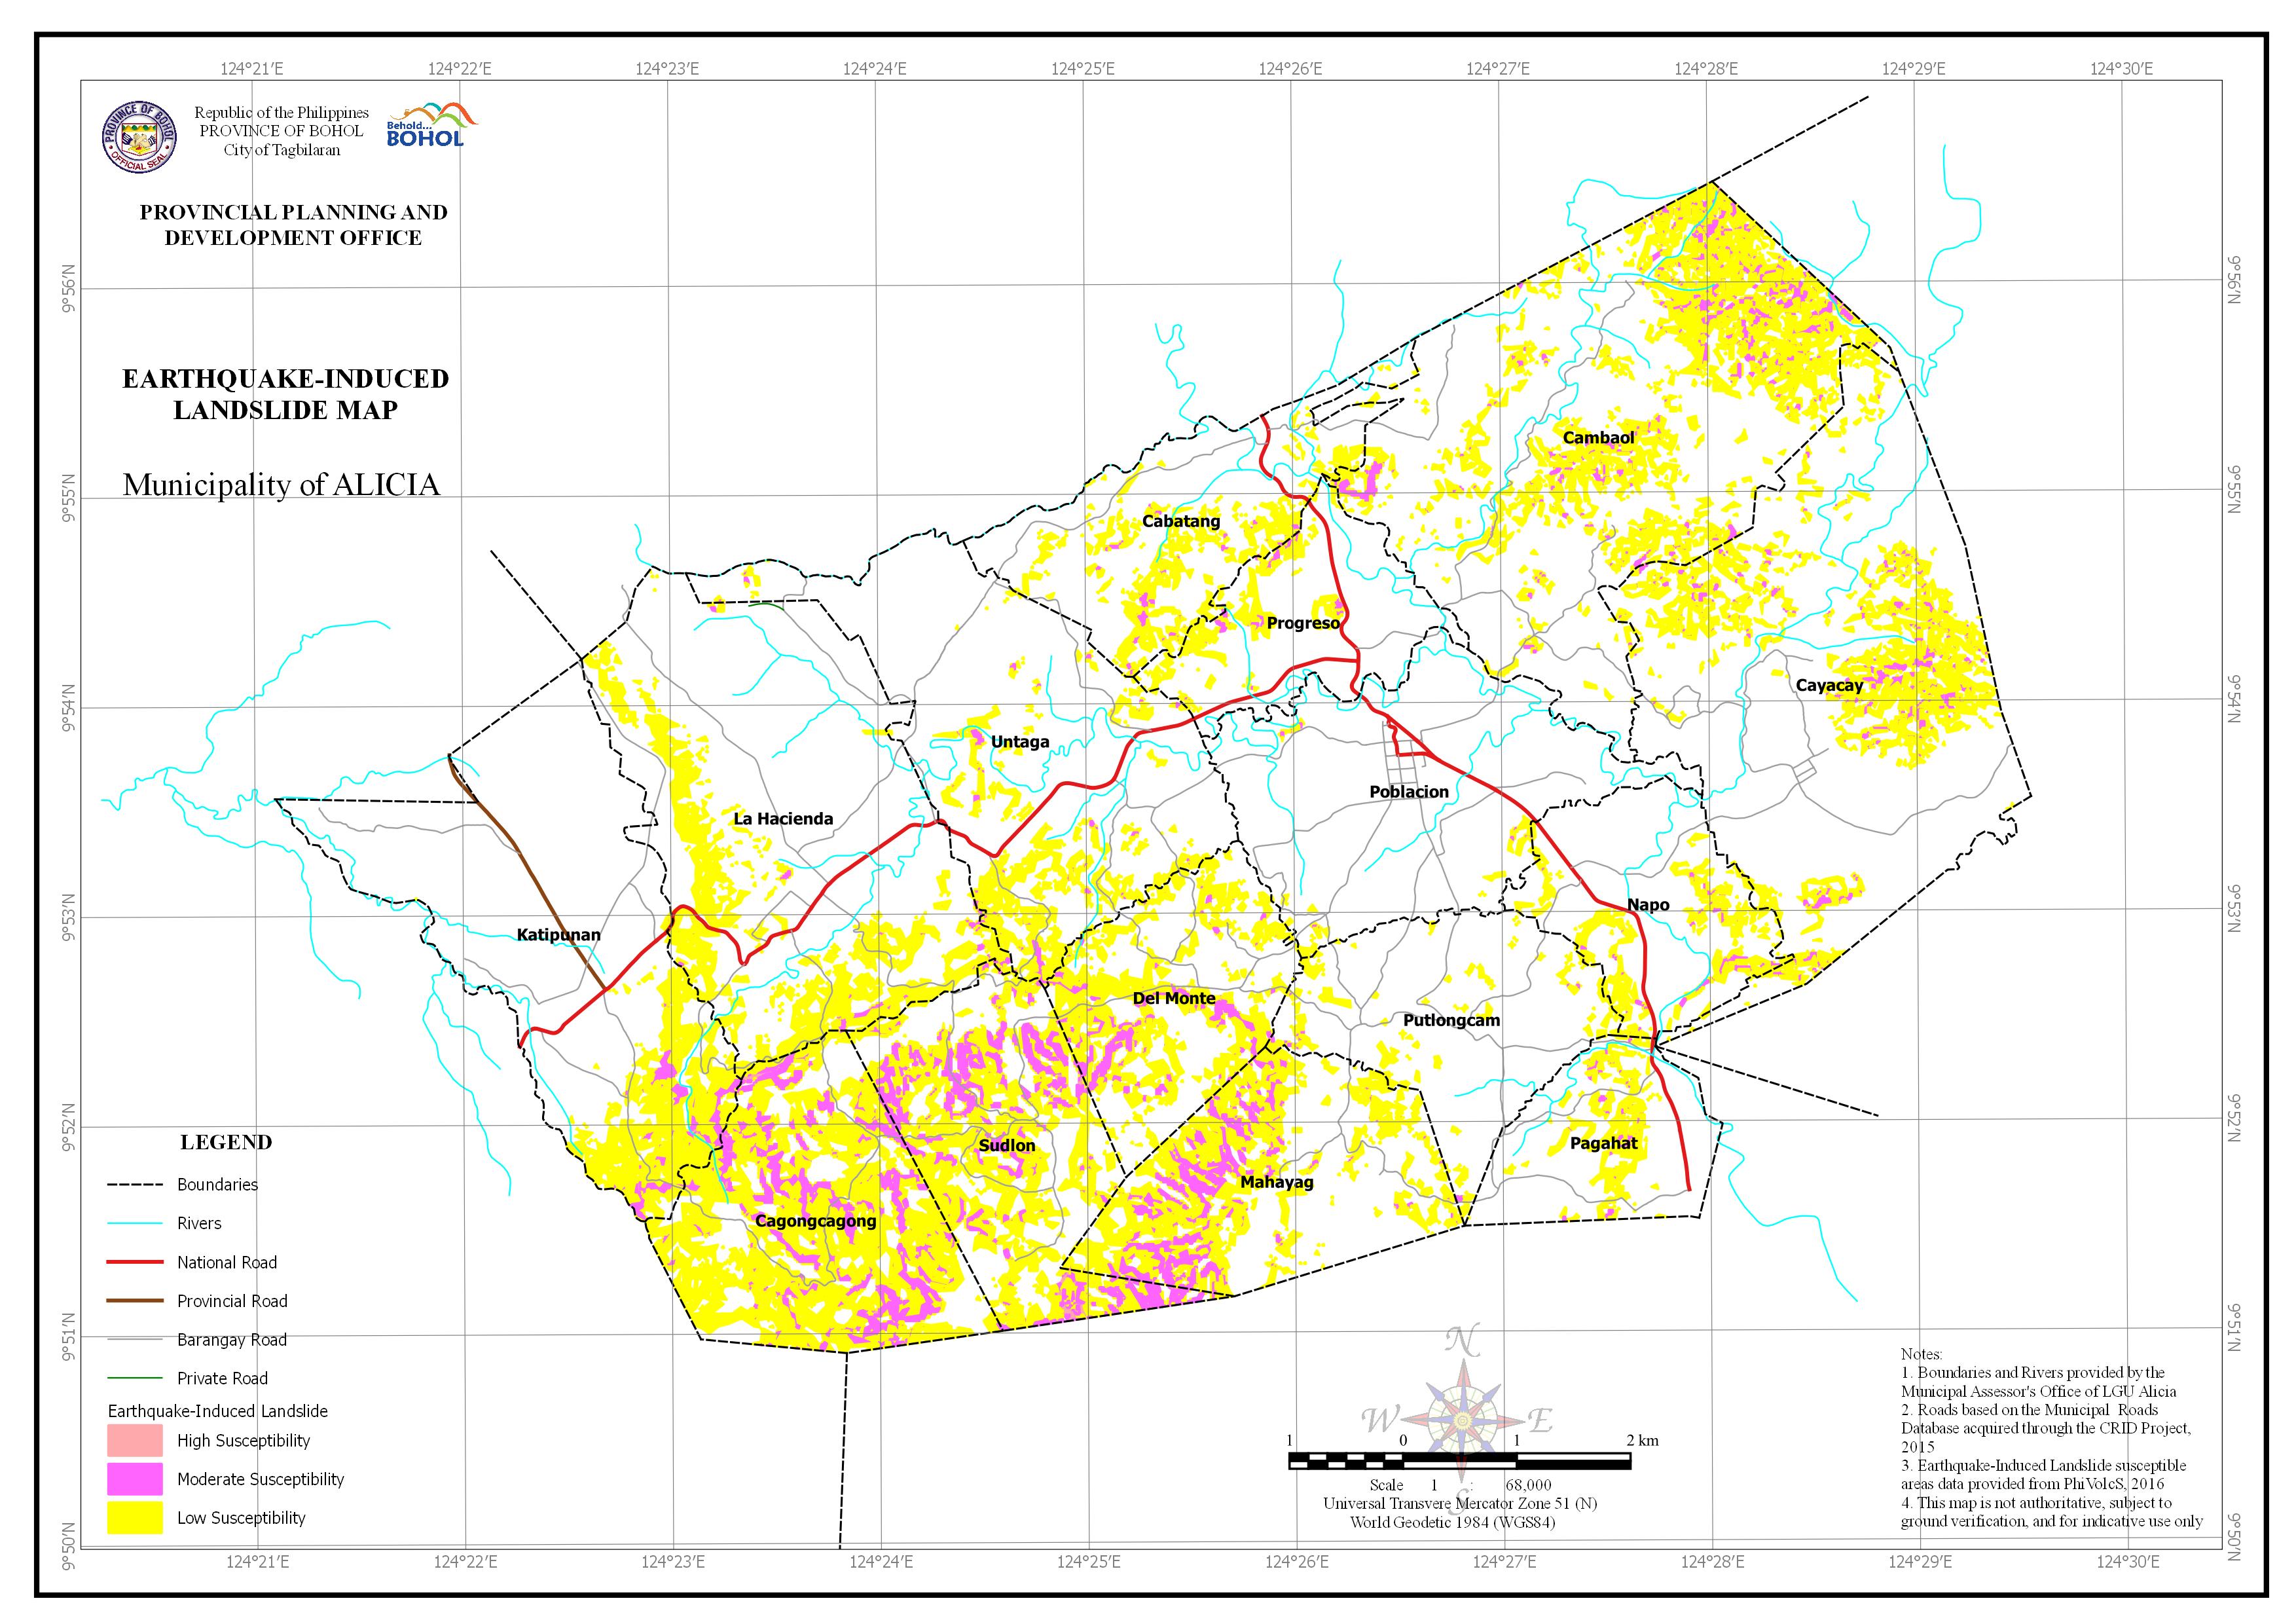
AREA EXPOSED TO EARTHQUAKE-INDUCED LANDSLIDE BY BARANGAY
| Barangay | Area | Area Exposed to High Susceptibility | Area Exposed to Moderate Susceptibility | Area Exposed to Low Susceptibility | |||
| (Hectares) | (Hectares) | (Percentage) | (Hectares) | (Percentage) | (Hectares) | (Percentage) | |
| Cabatang | 425.212 | 4.797 | 1.13% | 61.743 | 14.52% | ||
| Cagongcagong | 539.183 | 2.236 | 0.42% | 92.469 | 17.15% | 268.626 | 49.82% |
| Cambaol | 1,212.39 | 0.027 | 0.00% | 52.722 | 4.35% | 243.436 | 20.08% |
| Cayacay | 1,146.16 | 0.04 | 0.00% | 25.909 | 2.26% | 156.167 | 13.63% |
| Del Monte | 372.367 | 0.066 | 0.02% | 26.088 | 7.01% | 107.979 | 29.00% |
| Katipunan | 823.27 | 0.267 | 0.03% | 19.808 | 2.41% | 102.818 | 12.49% |
| La Hacienda | 967.4 | 6.502 | 0.67% | 146.573 | 15.15% | ||
| Mahayag | 479.164 | 0.56 | 0.12% | 55.741 | 11.63% | 142.465 | 29.73% |
| Napo | 335.262 | 5.279 | 1.58% | 44.208 | 13.19% | ||
| Pagahat | 260.509 | 4.624 | 1.78% | 33.622 | 12.91% | ||
| Poblacion | 626.04 | 0.721 | 0.12% | 7.466 | 1.19% | ||
| Progreso | 295.251 | 3.726 | 1.26% | 28.717 | 9.73% | ||
| Putlongcam | 415.066 | 1.558 | 0.38% | 23.504 | 5.66% | ||
| Sudlon | 468.629 | 2.372 | 0.51% | 74.748 | 15.95% | 171.276 | 36.55% |
| Untaga | 763.01 | 6.95 | 0.91% | 75.691 | 9.92% | ||
| Total | 9,128.92 | 5.568 | 0.06% | 381.643 | 4.18% | 1,614.29 | 17.68% |