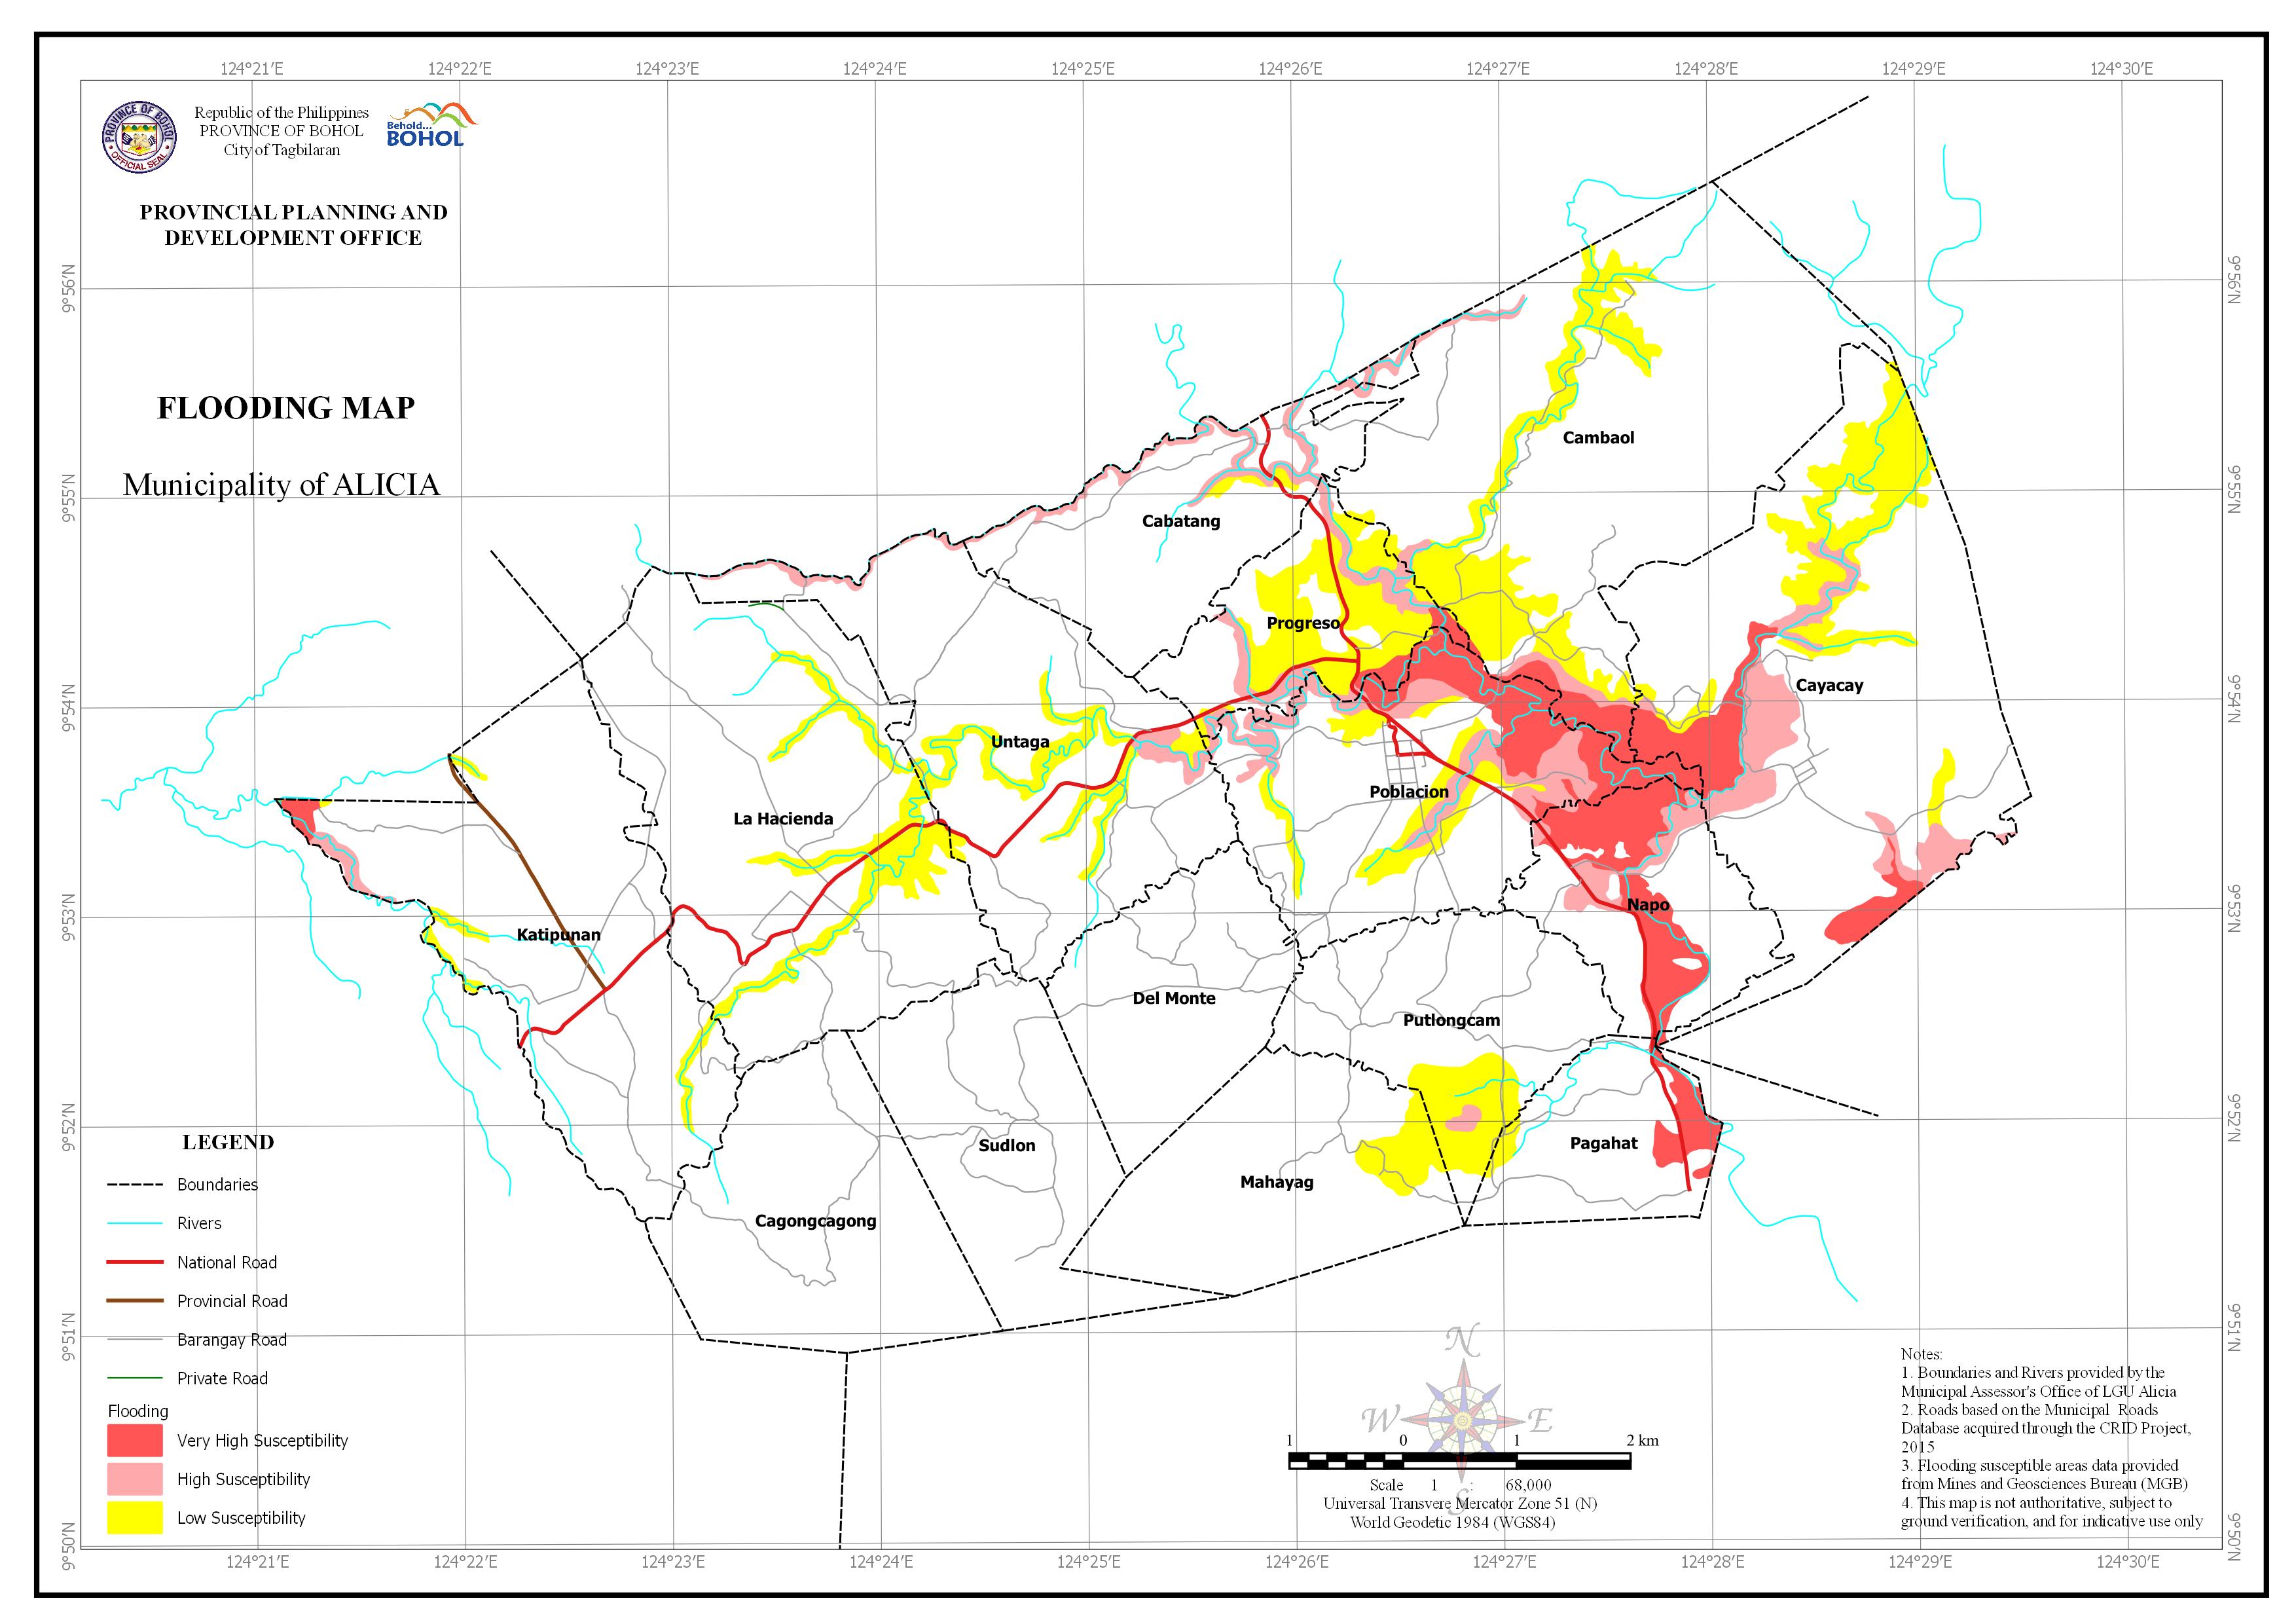
Download in PDF and JPG format
AREA EXPOSED TO FLOODING BY BARANGAY
| Barangay | Area | Area Exposed to Very High Susceptibility | Area Exposed to High Susceptibility | Area Exposed to Low Susceptibility | |||
| (Hectares) | (Hectares) | (Percentage) | (Hectares) | (Percentage) | (Hectares) | (Percentage) | |
| Cabatang | 425.212 | 37.61 | 8.85% | 6.352 | 1.49% | ||
| Cagongcagong | 539.183 | ||||||
| Cambaol | 1,212.39 | 31.647 | 2.61% | 17.698 | 1.46% | 159.745 | 13.18% |
| Cayacay | 1,146.16 | 80.461 | 7.02% | 88.261 | 7.70% | 138.964 | 12.12% |
| Del Monte | 372.367 | ||||||
| Katipunan | 823.27 | 7.274 | 0.88% | 9.054 | 1.10% | 18.827 | 2.29% |
| La Hacienda | 967.4 | 90.575 | 9.36% | ||||
| Mahayag | 479.164 | 34.44 | 7.19% | ||||
| Napo | 335.262 | 107.351 | 32.02% | 28.945 | 8.63% | ||
| Pagahat | 260.509 | 28.684 | 11.01% | 6.629 | 2.55% | ||
| Poblacion | 626.04 | 115.217 | 18.40% | 81.217 | 12.97% | 61.667 | 9.85% |
| Progreso | 295.251 | 14.906 | 5.05% | 41.838 | 14.17% | 124.118 | 42.04% |
| Putlongcam | 415.066 | 4.215 | 1.02% | 62.552 | 15.07% | ||
| Sudlon | 468.629 | ||||||
| Untaga | 763.01 | 23.134 | 3.03% | 69.499 | 9.11% | ||
| Total | 9,128.92 | 385.54 | 4.22% | 331.97 | 3.64% | 773.367 | 8.47% |

