
TSUNAMI HAZARD MAP, 2016 update
Download in JPG or in PDF formats
TSUNAMI HAZARD MAP, 2008

Download in PDF or in JPG formats
A tsunami is a series of water waves caused by the displacement of a large volume of a body of water, typically an ocean or a large lake. Earthquakes, volcanic eruptions and other underwater explosions (including detonations of underwater nuclear devices), landslides, glacier calvings, meteorite impacts and other disturbances above or below water all have the potential to generate a tsunami.
Tsunami waves do not resemble normal sea waves, because their wavelength is far longer. Rather than appearing as a breaking wave, a tsunami may instead initially resemble a rapidly rising tide, and for this reason they are often referred to as tidal waves. Tsunamis generally consist of a series of waves with periods ranging from minutes to hours, arriving in a so-called “wave train”. Wave heights of tens of meters can be generated by large events. Although the impact of tsunamis is limited to coastal areas, their destructive power can be enormous and they can affect entire ocean basins; the 2004 Indian Ocean tsunami was among the deadliest natural disasters in human history with over 230,000 people killed in 14 countries bordering the Indian Ocean. (Wikipedia)
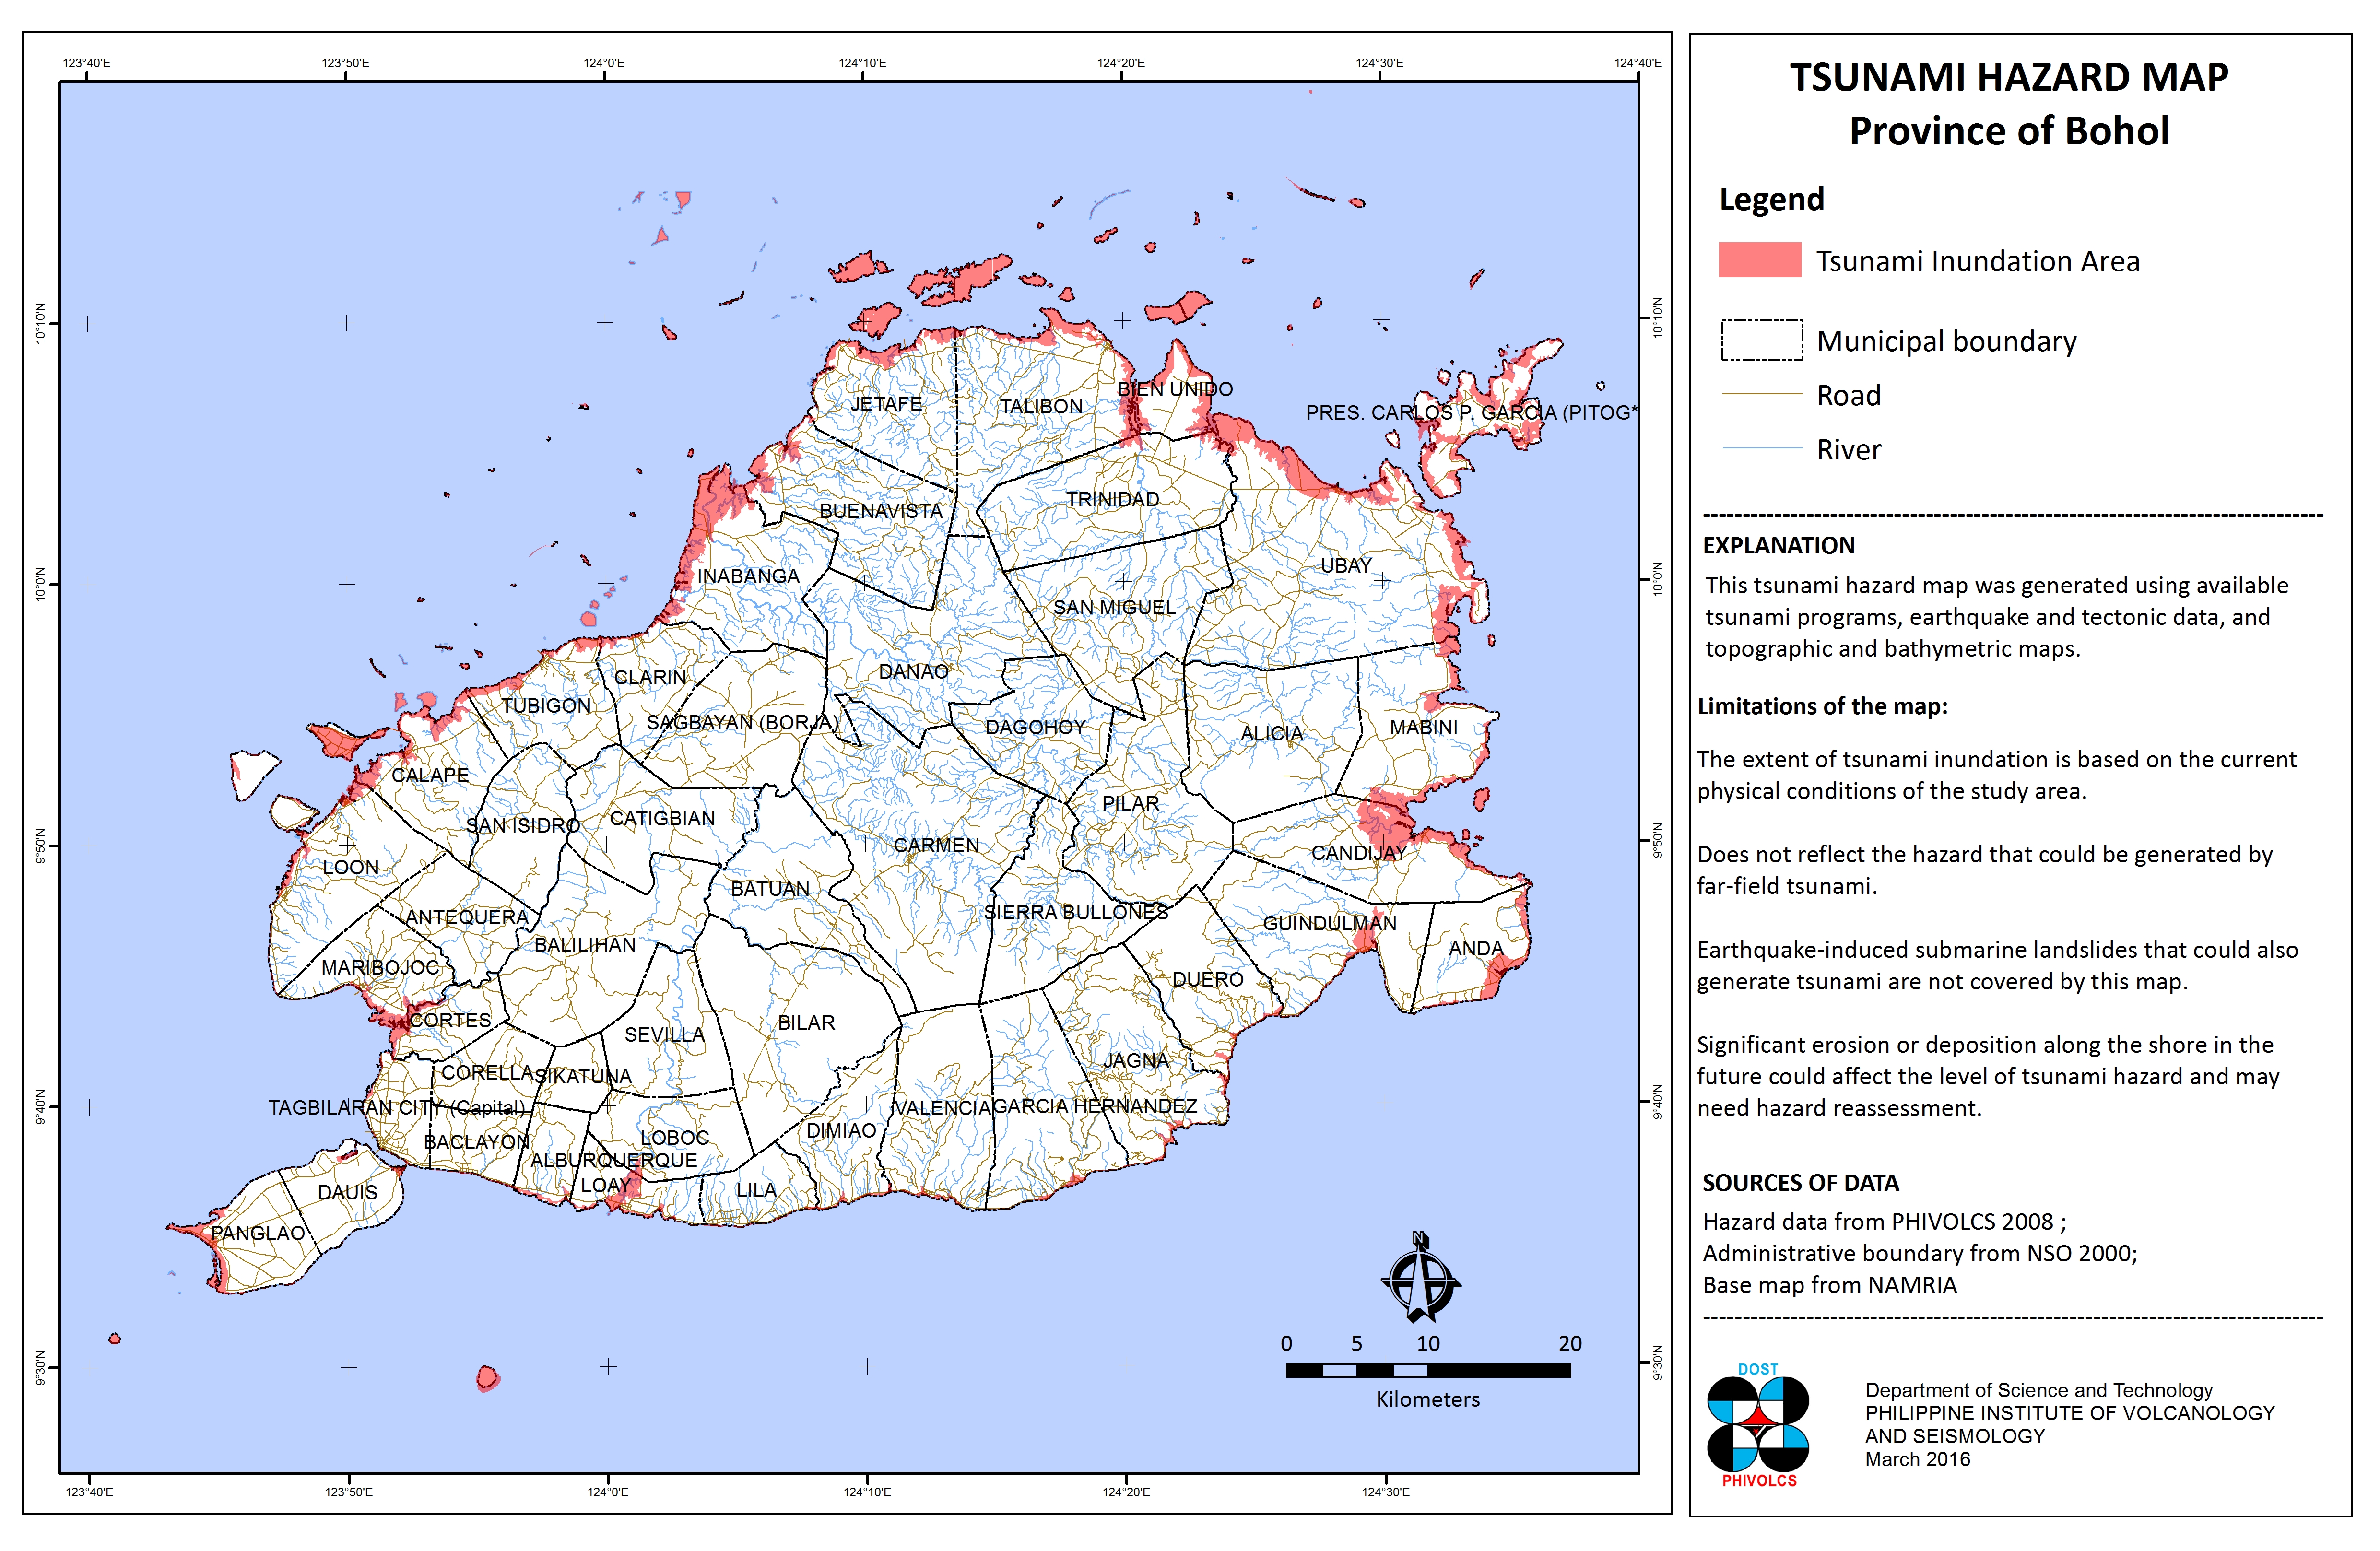
This Tsunami Hazard Map shows areas that may be affected in the event of a tsunami. This tsunami hazard map was generated using available tsunami programs, earthquake and tectonic data, and topographic and bathymetric maps.
Some limitations to this map needs proper consideration and as follows:
- The extent of tsunami inundation is based on current physical conditions of the study area.
- Does not reflect the hazard that could be generated by far-field tsunami.
- Earthquake-induced submarine landslides that could also generate tsunami are not covered by this map.
- Significant erosion or deposition along the shore in the future could affect the level of tsunami hazard and may need hazard reassessment.
The tsunami hazard data is from the Philippine Institute of Volcanology and Seismology (PhIVolcS), the Administrative boundary is from the National Statistics Office (NSO) 2000, and, the Topographic Map 1:50,000 scale is from the National Mapping and Resource Information Authority (NAMRIA). This Tsunami Hazard Map was acquired from the Hazards Mapping and Assessment for Effective Community-Based Disaster Risk Management (READY) Project through (PhIVolcS).
Available in PDF and JPG, this map may be downloaded and used for free provided that: a.) no alterations are made to the map; b.) proper citations be referred to the sources mentioned above; and, c.) all logos appearing on the map should also appear on your document.
Sir good day,
The Municipality of Candijay would like to ask a shapefile copy of Tsunami Hazard for our CLUP consumption.. We are hoping for your favourable response. Thank you and godbless!
Hi Sir Justine, we sent it by email to the MPDC.