Download in PDF and JPG format
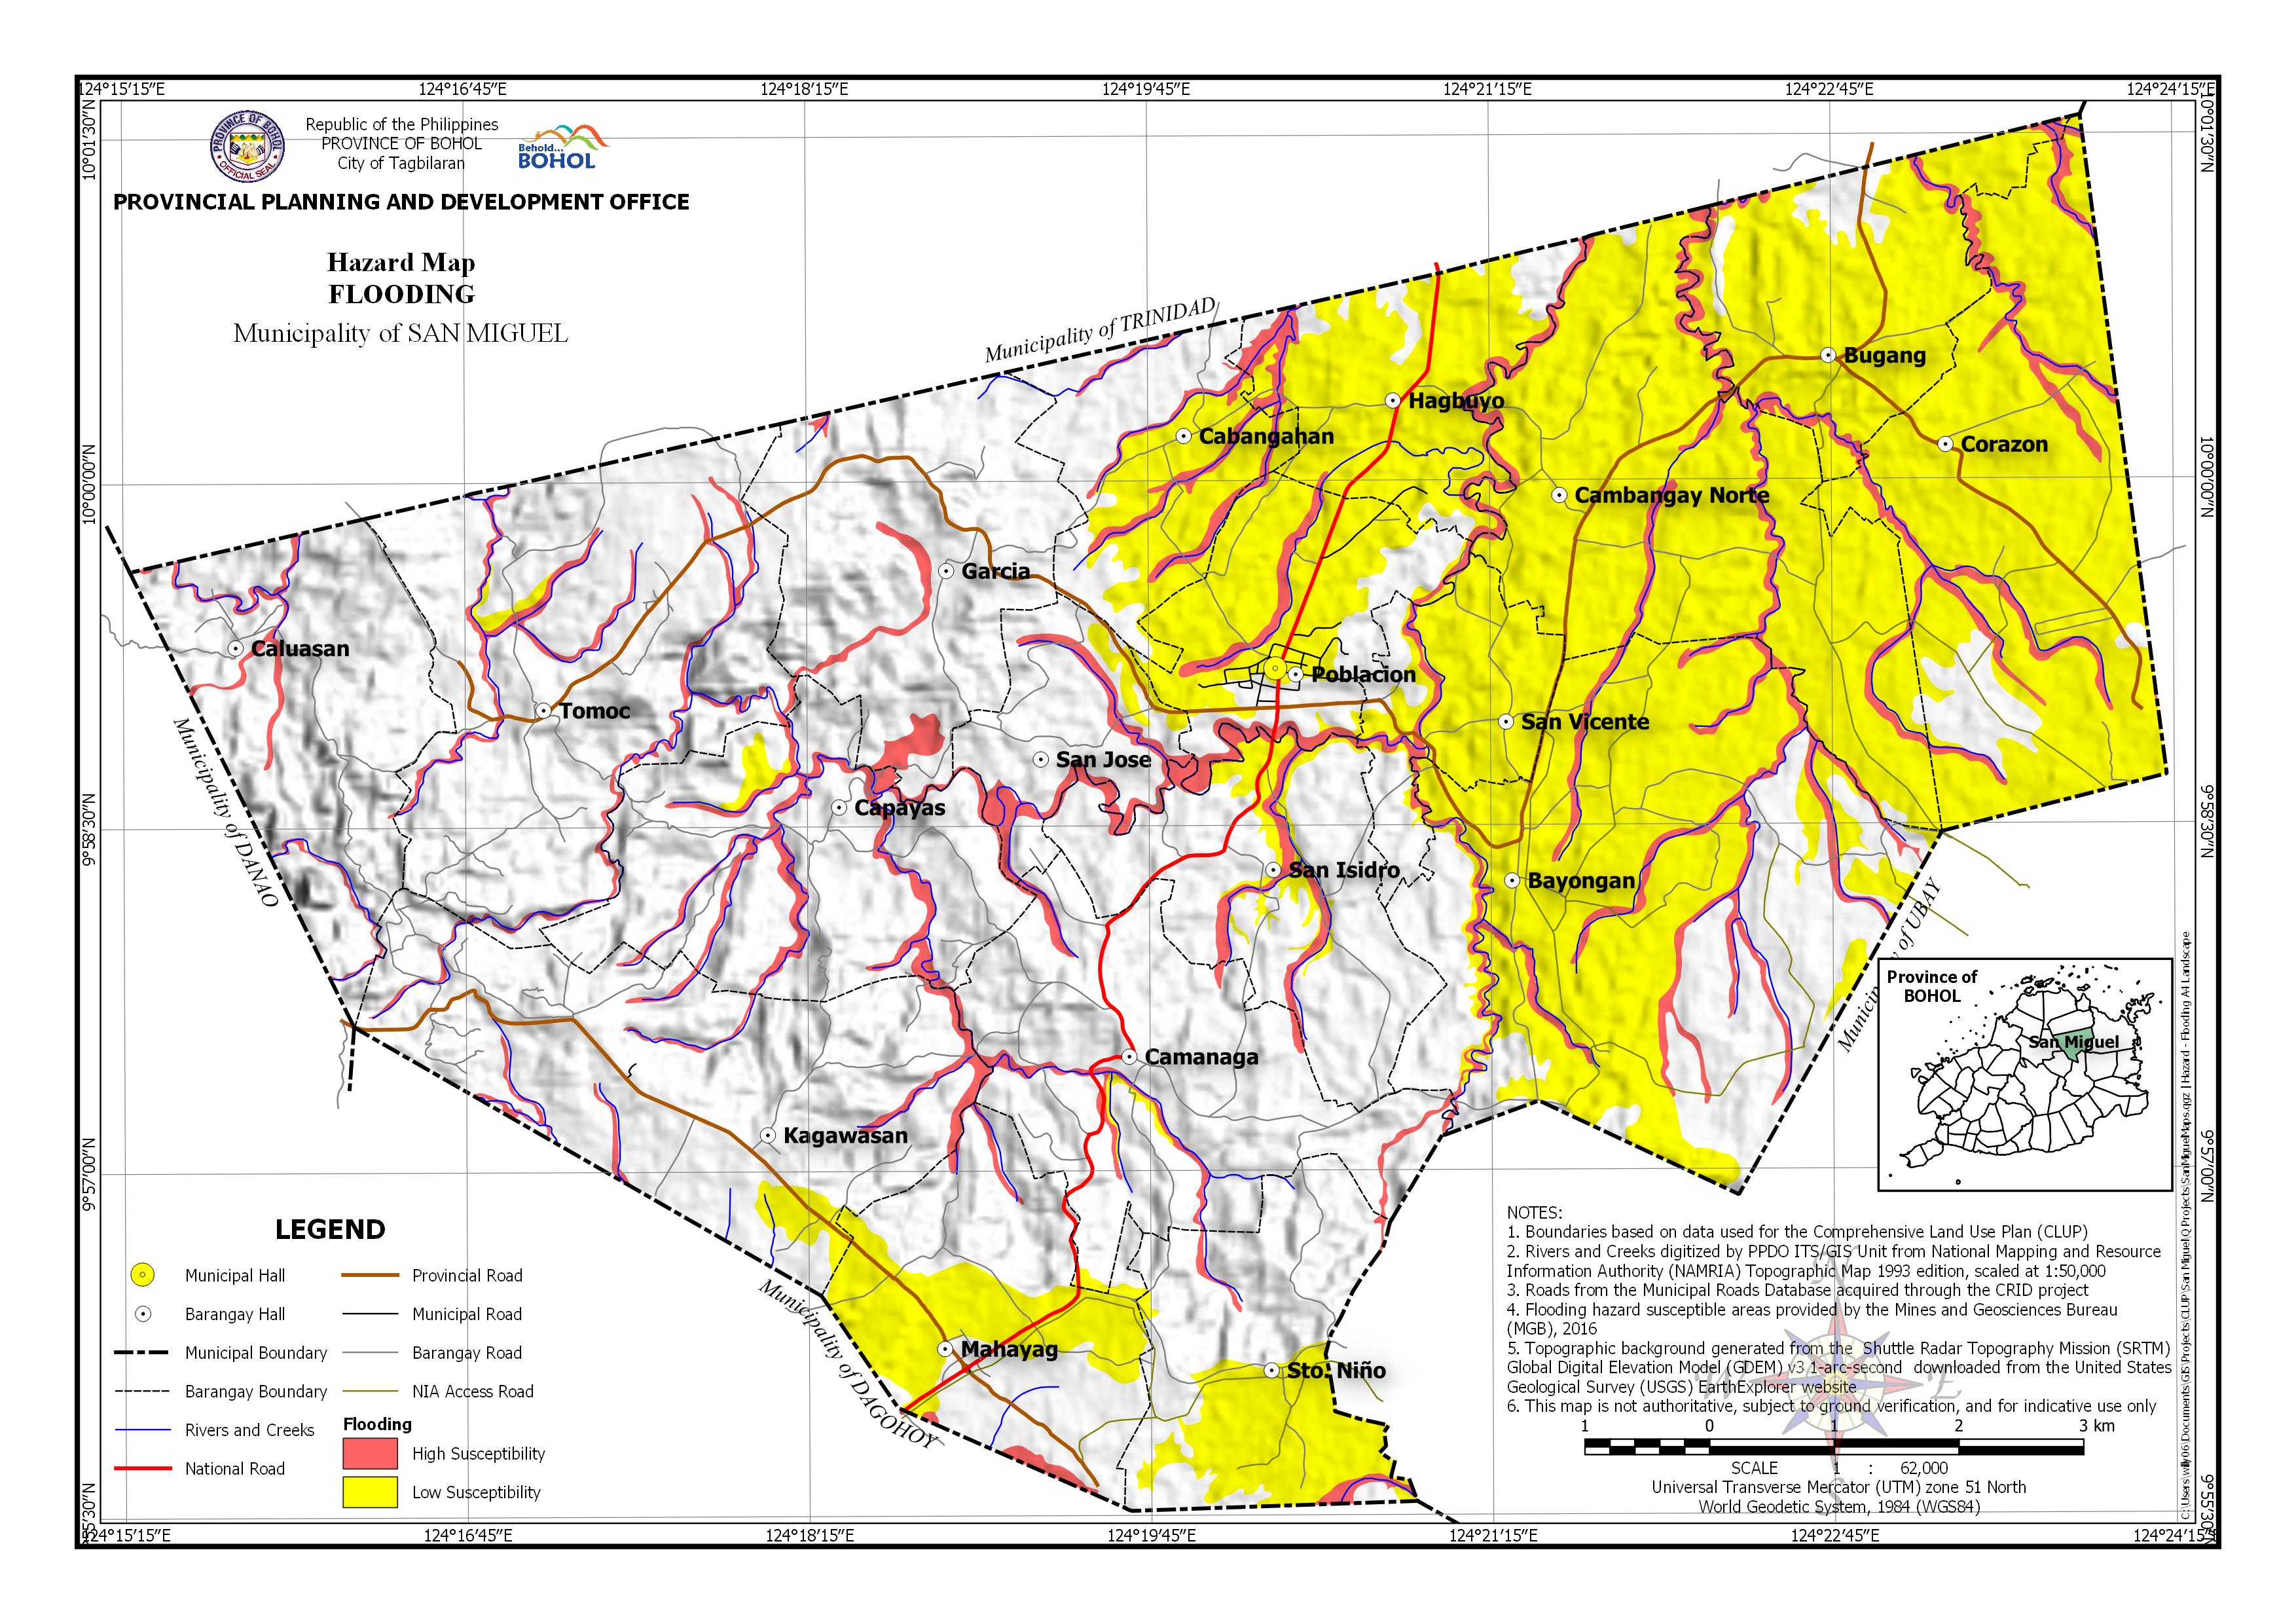
BARANGAY AREA EXPOSED TO FLOODING HAZARD
| Barangay | Area | Barangay Area Exposed to High Susceptibility | Barangay Area Exposed to Low Susceptibility | ||
| (Hectares) | (Hectares) | (Percentage) | (Hectares) | (Percentage) | |
| Bayongan | 1,250.10 | 115.091 | 9.21% | 705.129 | 56.41% |
| Bugang | 440.944 | 28.551 | 6.48% | 377.689 | 85.66% |
| Cabangahan | 339.211 | 37.508 | 11.06% | 149.843 | 44.17% |
| Caluasan | 524.448 | 30.219 | 5.76% | ||
| Camanaga | 656.314 | 40.669 | 6.20% | 8.734 | 1.33% |
| Cambangay Norte | 858.694 | 59.175 | 6.89% | 793.936 | 92.46% |
| Capayas | 590.621 | 81.18 | 13.75% | 11.95 | 2.02% |
| Corazon | 848.991 | 65.07 | 7.66% | 727.226 | 85.66% |
| Garcia | 569.211 | 33.027 | 5.80% | 0.02 | 0.00% |
| Hagbuyo | 367.155 | 34.834 | 9.49% | 286.036 | 77.91% |
| Kagawasan | 819.411 | 45.624 | 5.57% | 28.079 | 3.43% |
| Mahayag | 492.551 | 15.257 | 3.10% | 182.574 | 37.07% |
| Poblacion | 358.19 | 36.545 | 10.20% | 231.039 | 64.50% |
| San Isidro | 470.994 | 48.369 | 10.27% | 45.96 | 9.76% |
| San Jose | 234.559 | 44.342 | 18.90% | 19.232 | 8.20% |
| San Vicente | 248.082 | 14.097 | 5.68% | 172.621 | 69.58% |
| Sto. Niño | 441.053 | 12.052 | 2.73% | 157.352 | 35.68% |
| Tomoc | 886.864 | 73.267 | 8.26% | 7.328 | 0.83% |
| Total | 10,397.39 | 814.876 | 7.84% | 3,904.75 | 37.56% |

