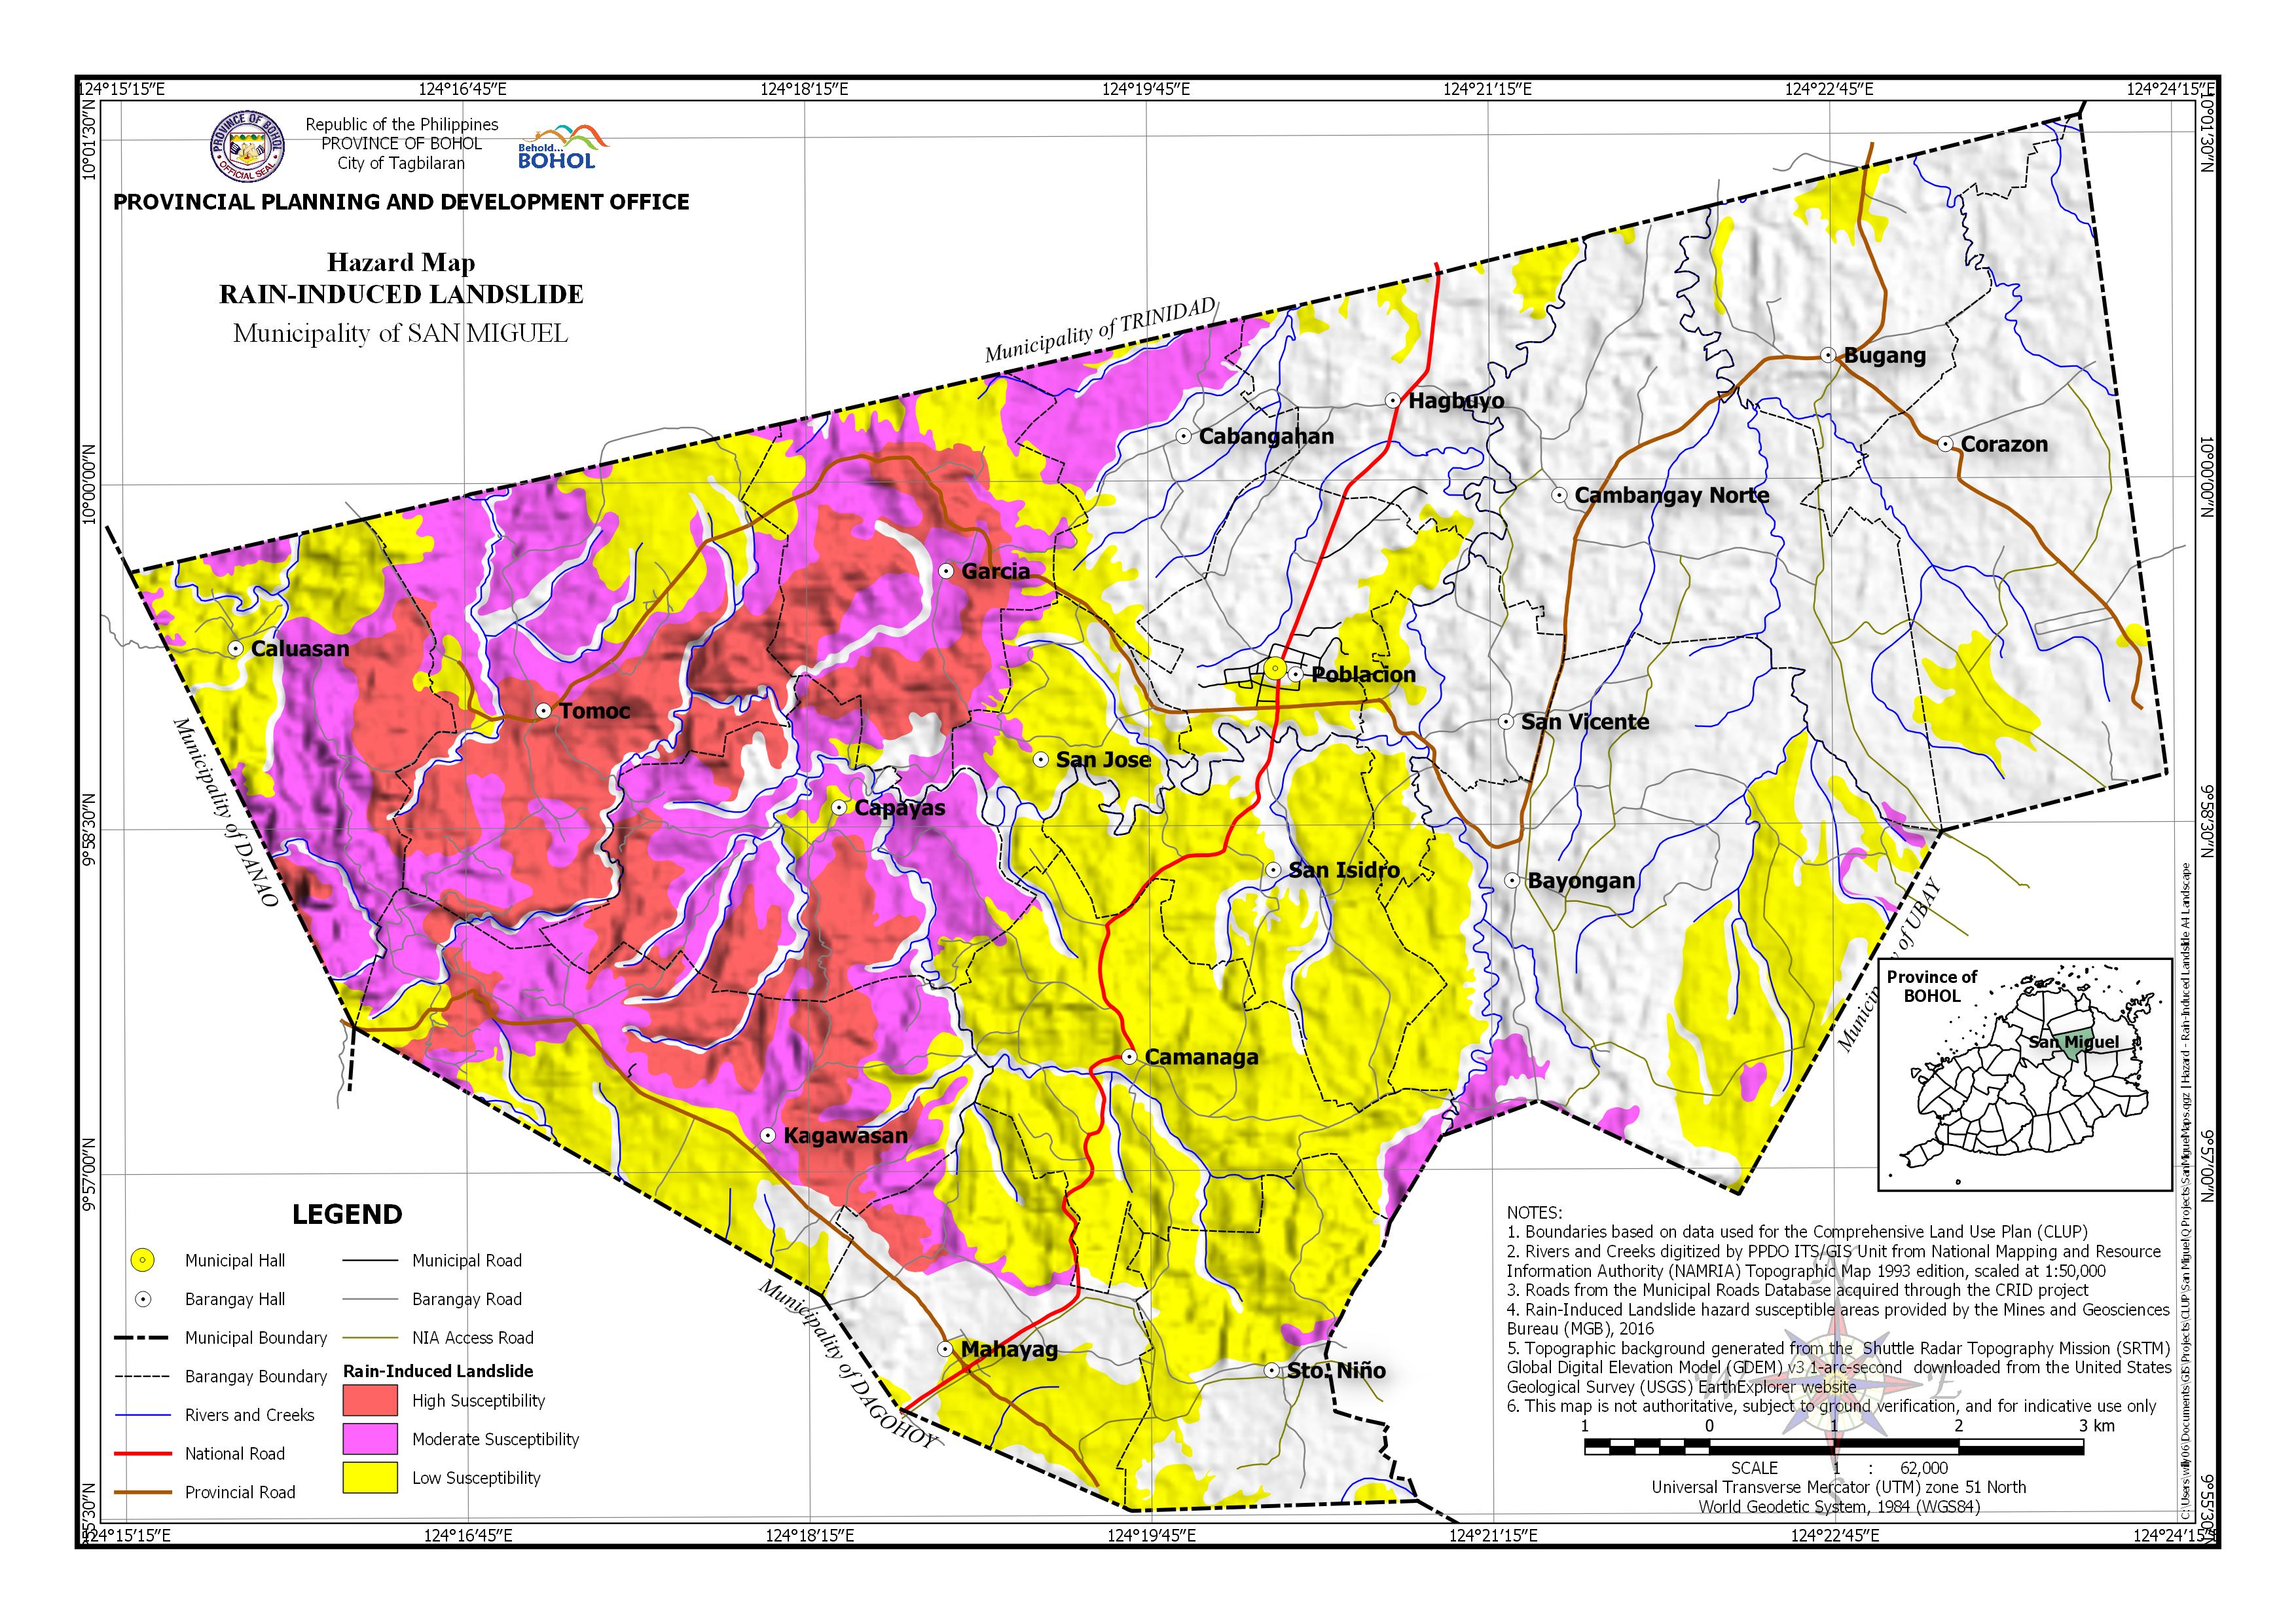
Download in PDF and JPG format
BARANGAY AREA EXPOSED TO RAIN-INDUCED LANDSLIDE
| Barangay | Area | Barangay Area Exposed to High Susceptibility | Barangay Area Exposed to Moderate Susceptibility | Barangay Area Exposed to Low Susceptibility | |||
| (Hectares) | (Hectares) | (Percentage) | (Hectares) | (Percentage) | (Hectares) | (Percentage) | |
| Bayongan | 1,250.10 | 45.508 | 3.64% | 384.37 | 30.75% | ||
| Bugang | 440.944 | 34.705 | 7.87% | ||||
| Cabangahan | 339.211 | 111.258 | 32.80% | 40.603 | 11.97% | ||
| Caluasan | 524.448 | 100.197 | 19.11% | 213.97 | 40.80% | 180.062 | 34.33% |
| Camanaga | 656.314 | 20.439 | 3.11% | 586.472 | 89.36% | ||
| Cambangay Norte | 858.694 | 1.928 | 0.23% | 3.654 | 0.43% | ||
| Capayas | 590.621 | 188.361 | 31.89% | 276.846 | 46.87% | 32.285 | 5.47% |
| Corazon | 848.991 | 56.695 | 6.68% | ||||
| Garcia | 569.211 | 215.257 | 37.82% | 210.714 | 37.02% | 110.192 | 19.36% |
| Hagbuyo | 367.155 | 4.099 | 1.12% | 42.186 | 11.49% | ||
| Kagawasan | 819.411 | 223.955 | 27.33% | 264.331 | 32.26% | 257.423 | 31.42% |
| Mahayag | 492.551 | 20.019 | 4.06% | 29.696 | 6.03% | 245.004 | 49.74% |
| Poblacion | 358.19 | 90.606 | 25.30% | ||||
| San Isidro | 470.994 | 376.665 | 79.97% | ||||
| San Jose | 234.559 | 0.254 | 0.11% | 26.711 | 11.39% | 144.021 | 61.40% |
| San Vicente | 248.082 | 61.365 | 24.74% | ||||
| Sto. Niño | 441.053 | 6.061 | 1.37% | 265.588 | 60.22% | ||
| Tomoc | 886.864 | 325.264 | 36.68% | 305.229 | 34.42% | 175.774 | 19.82% |
| Total | 10,397.39 | 1,073.31 | 10.32% | 1,516.79 | 14.59% | 3,087.67 | 29.70% |

