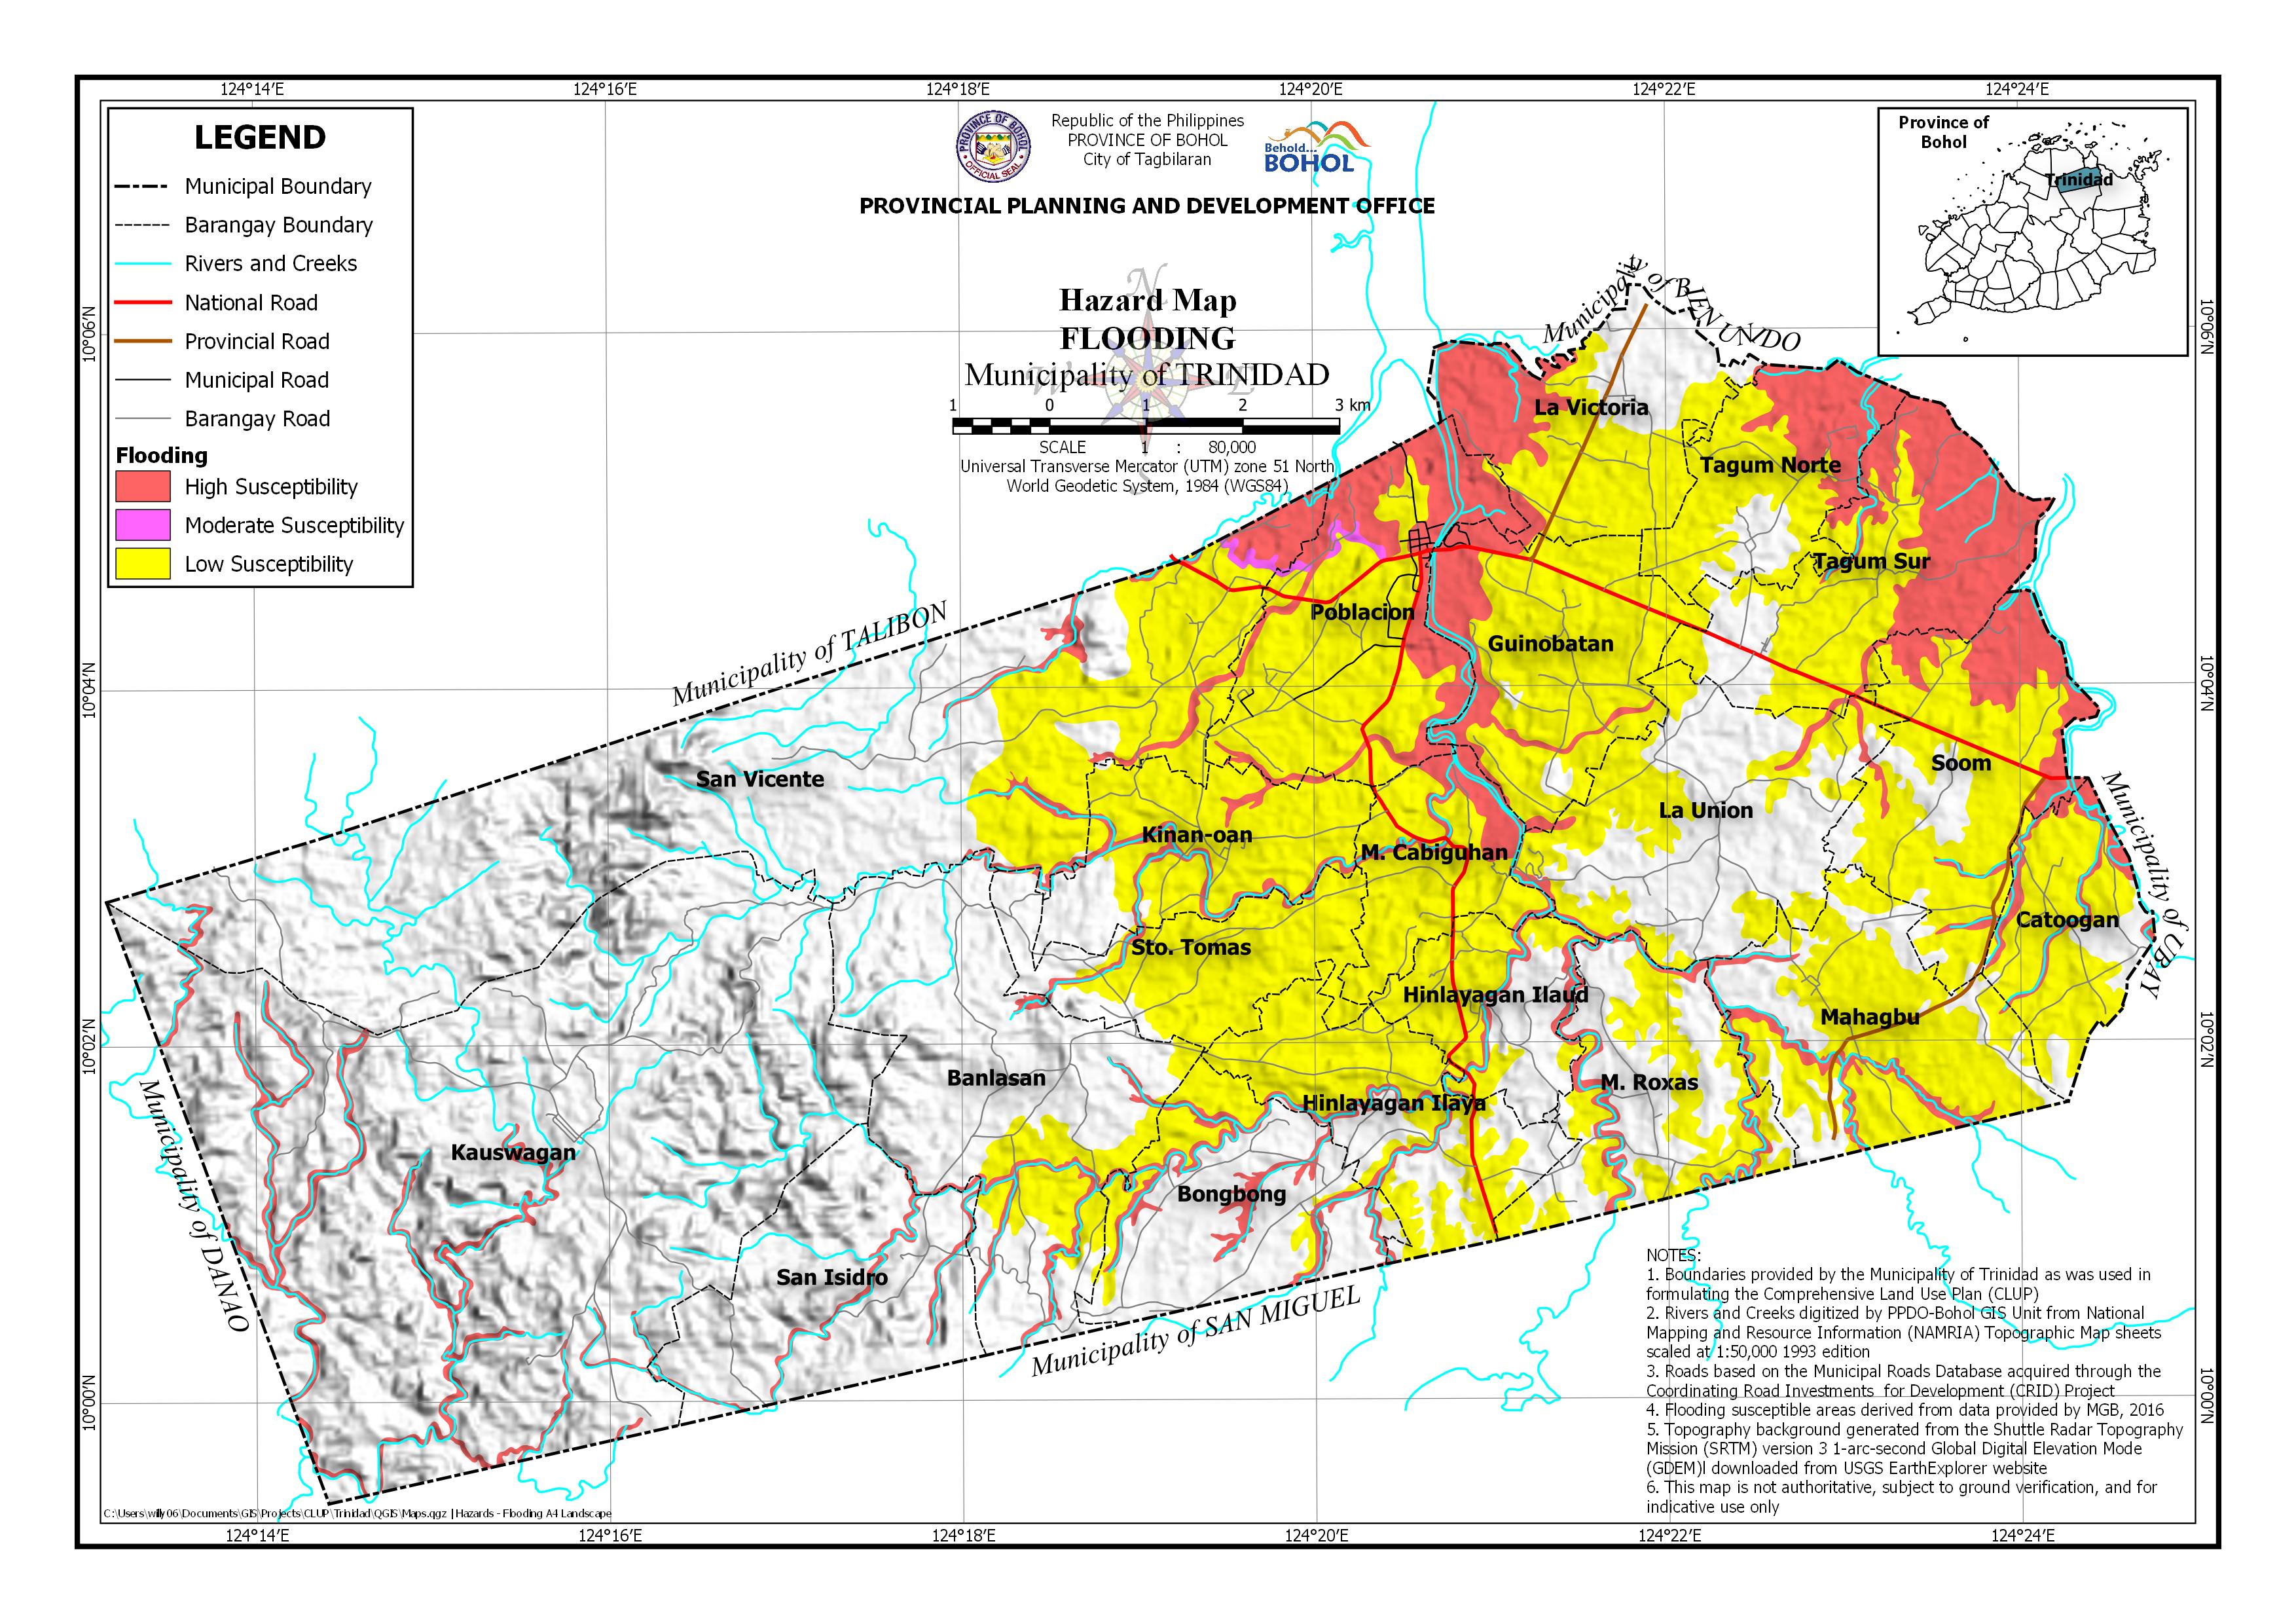
Download in PDF and JPG format
AREA EXPOSED TO FLOODING HAZARD BY BARANGAY
| Barangay | Area | Barangay Area Exposed to High Susceptibility | Barangay Area Exposed to Moderate Susceptibility | Barangay Area Exposed to Low Susceptibility | |||
| (Hectares) | (Hectares) | (Percentage) | (Hectares) | (Percentage) | (Hectares) | (Percentage) | |
| Banlasan | 988.739 | 49.095 | 4.97% | 142.53 | 14.42% | ||
| Bongbong | 540.748 | 75.293 | 13.92% | 99.216 | 18.35% | ||
| Catoogan | 335.1 | 47.938 | 14.31% | 232.082 | 69.26% | ||
| Guinobatan | 563.906 | 109.542 | 19.43% | 439.573 | 77.95% | ||
| Hinlayagan Ilaud | 306.645 | 28.676 | 9.35% | 167.471 | 54.61% | ||
| Hinlayagan Ilaya | 486.672 | 27.842 | 5.72% | 315.444 | 64.82% | ||
| Kauswagan | 3,091.78 | 160.611 | 5.20% | ||||
| Kinan-oan | 439.893 | 44.582 | 10.14% | 324.64 | 73.80% | ||
| La Union | 724.351 | 22.882 | 3.16% | 253.141 | 34.95% | ||
| La Victoria | 516.037 | 133.795 | 25.93% | 235.618 | 45.66% | ||
| M. Cabiguhan | 306.975 | 65.298 | 21.27% | 241.677 | 78.73% | ||
| M. Roxas | 512.497 | 52.831 | 10.31% | 193.547 | 37.77% | ||
| Mahagbu | 627.355 | 55.242 | 8.81% | 399.531 | 63.69% | ||
| Poblacion | 671.786 | 225.132 | 33.51% | 9.369 | 1.40% | 437.285 | 65.09% |
| San Isidro | 620.653 | 30.814 | 4.97% | 0.015 | 0.00% | ||
| San Vicente | 2,233.06 | 108.444 | 4.86% | 6.73 | 0.30% | 444.745 | 19.92% |
| Soom | 616.046 | 147.557 | 23.95% | 378.238 | 61.40% | ||
| Sto. Tomas | 401.716 | 11.439 | 2.85% | 292.637 | 72.85% | ||
| Tagum Norte | 392.375 | 124.519 | 31.74% | 215.592 | 54.95% | ||
| Tagum Sur | 613.829 | 278.055 | 45.30% | 259.145 | 42.22% | ||
| Total | 14,990.16 | 1,799.59 | 12.01% | 16.098 | 0.11% | 5,072.13 | 33.84% |

