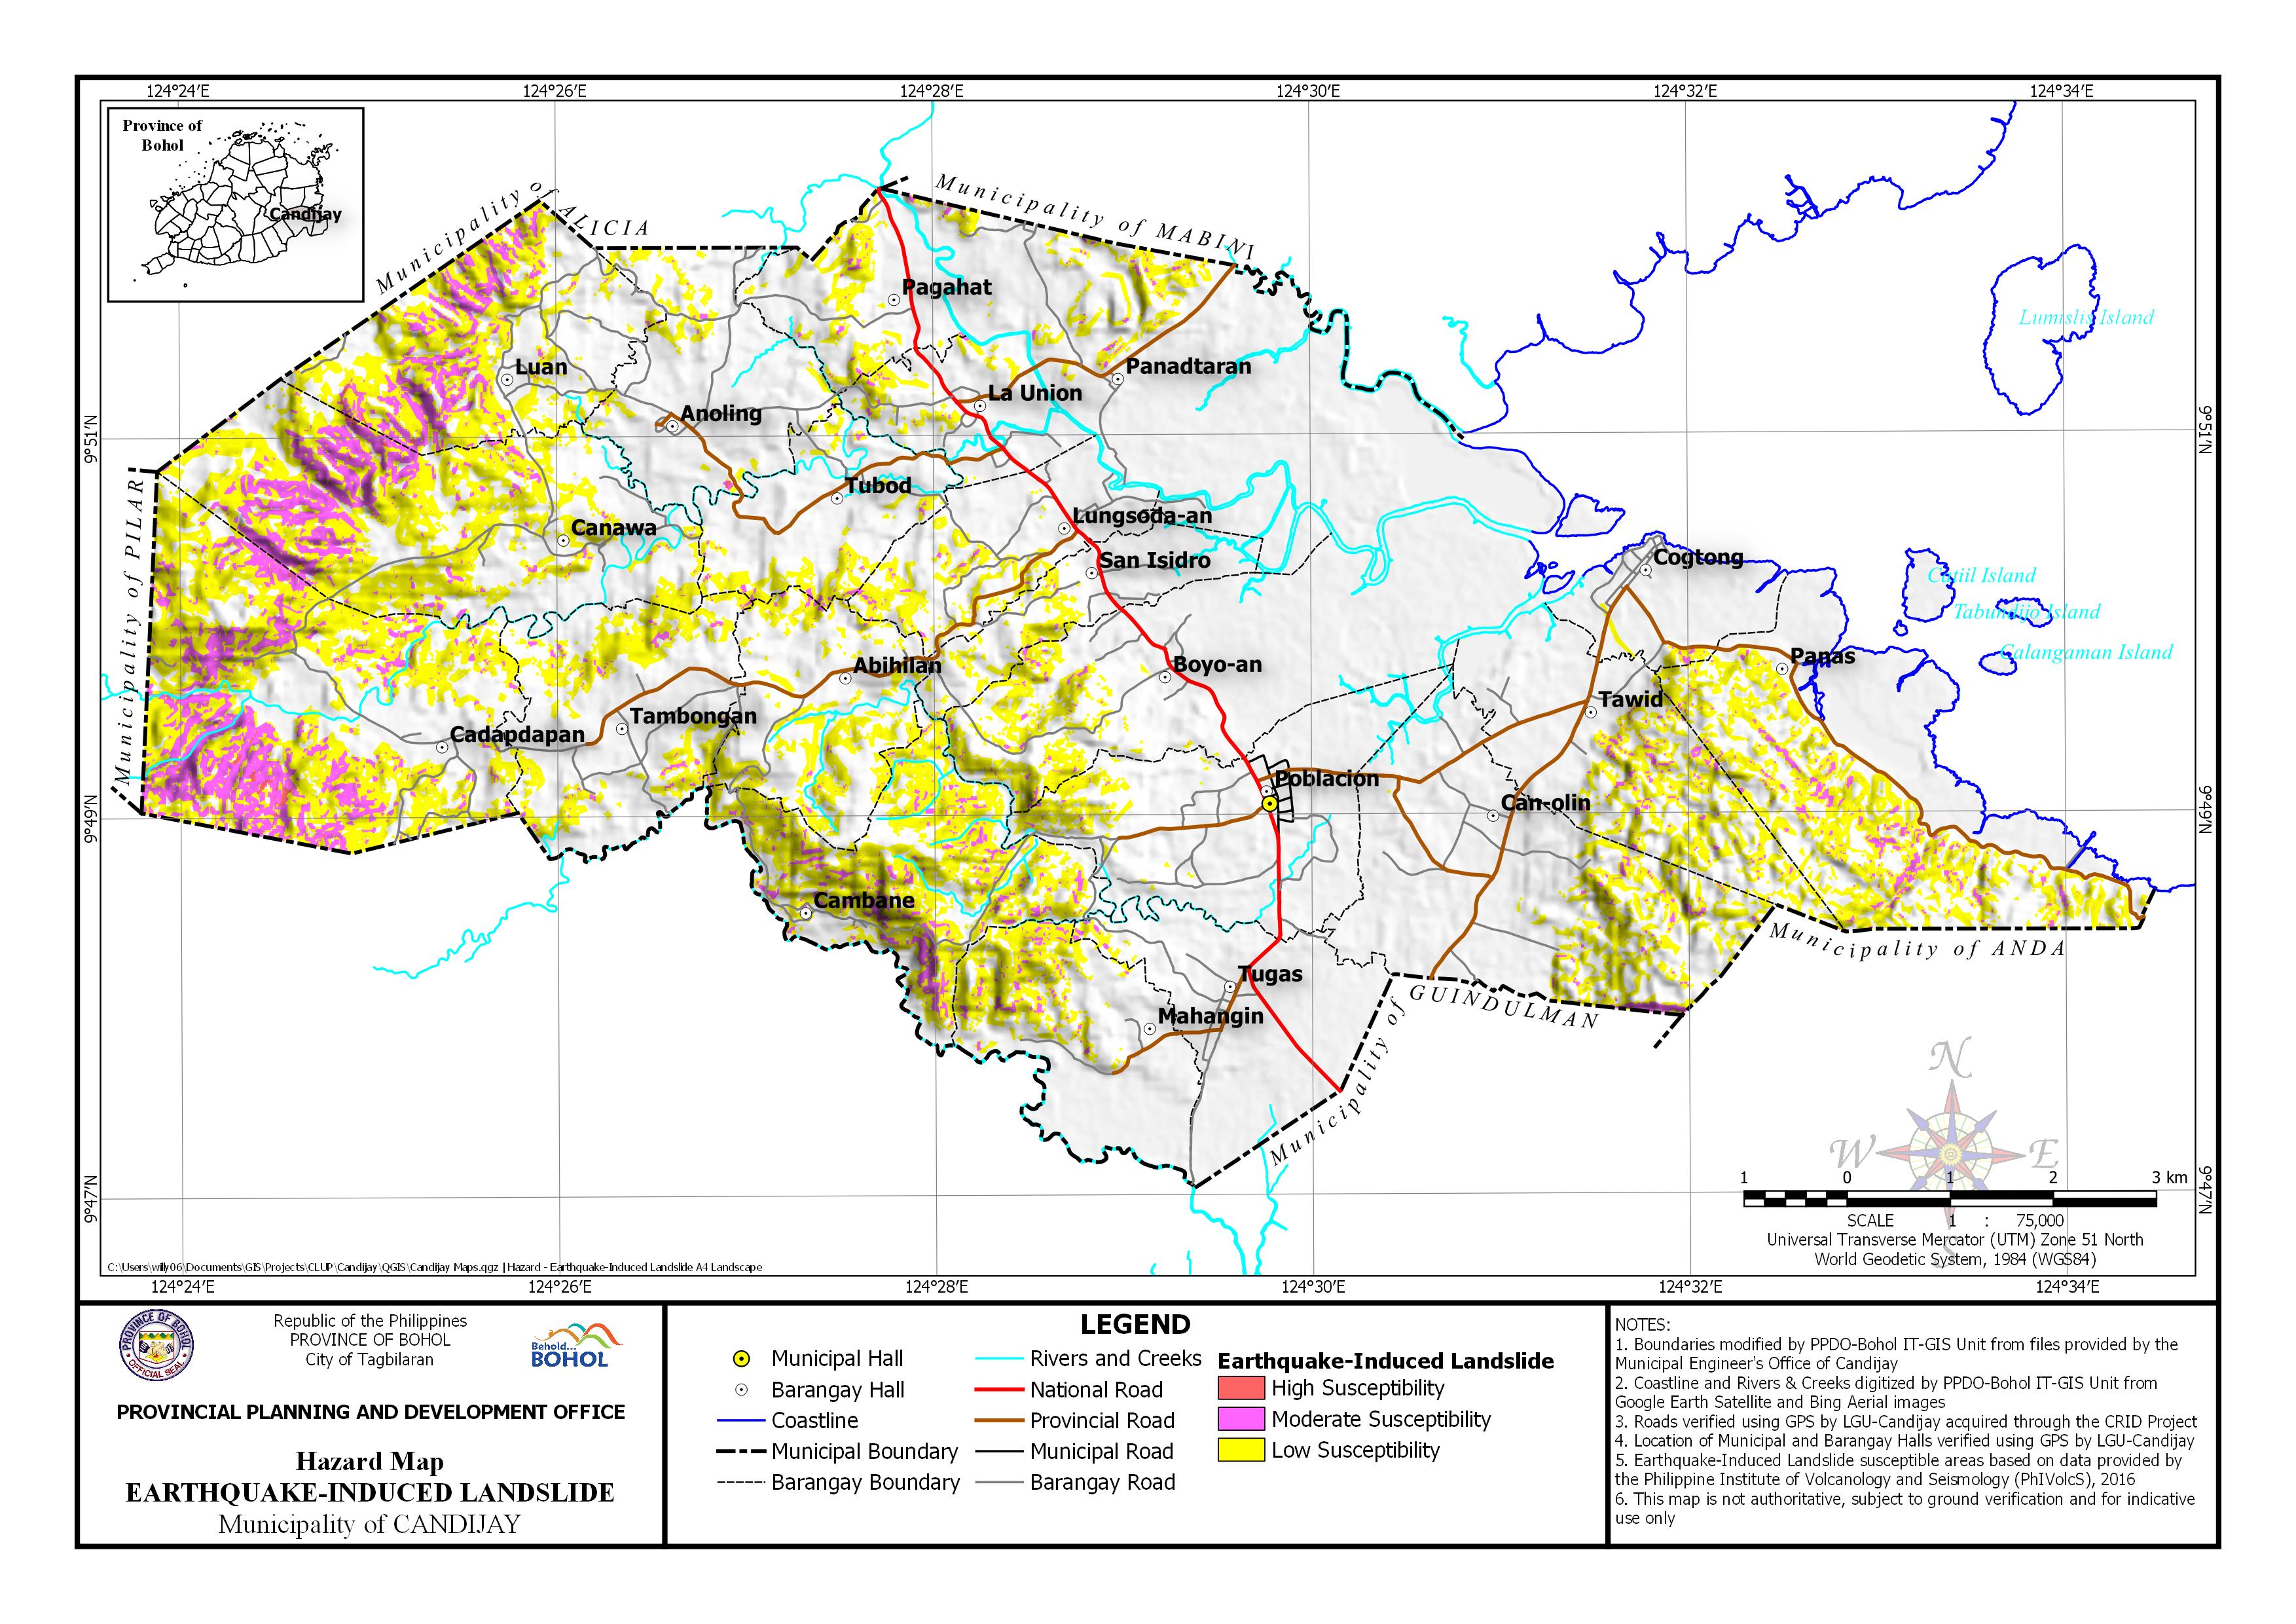
Download in PDF and JPG format
AREA EXPOSED TO EARTHQUAKE-INDUCED LANDSLIDE BY BARANGAY
| Barangay | Area | Area Exposed to High Susceptibility | Area Exposed to Moderate Susceptibility | Area Exposed to Low Susceptibility | |||
| (Hectares) | (Hectares) | (Percentage) | (Hectares) | (Percentage) | (Hectares) | (Percentage) | |
| Abihilan | 349.259 | 0.04 | 0.01% | 4.669 | 1.34% | 69.714 | 19.96% |
| Anoling | 386.931 | 0.2 | 0.05% | 1.65 | 0.43% | 21.511 | 5.56% |
| Boyo-an | 772.874 | 7.179 | 0.93% | 62.005 | 8.02% | ||
| Cadapdapan | 888.484 | 7.098 | 0.80% | 185.931 | 20.93% | 339.127 | 38.17% |
| Cambane | 491.001 | 0.04 | 0.01% | 54.745 | 11.15% | 210.711 | 42.92% |
| Can-olin | 722.689 | 11.51 | 1.59% | 74.073 | 10.25% | ||
| Canawa | 763.727 | 2.644 | 0.35% | 106.289 | 13.92% | 264.563 | 34.64% |
| Cogtong | 185.749 | 1.034 | 0.56% | 5.786 | 3.12% | ||
| La Union | 207.807 | 2.176 | 1.05% | 16.534 | 7.96% | ||
| Luan | 496.681 | 2.179 | 0.44% | 75.633 | 15.23% | 158.161 | 31.84% |
| Lungsoda-an | 284.118 | 3.46 | 1.22% | 35.297 | 12.42% | ||
| Mahangin | 375.233 | 12.345 | 3.29% | 62.017 | 16.53% | ||
| Pagahat | 232.154 | 4.277 | 1.84% | 33.026 | 14.23% | ||
| Panadtaran | 1,003.93 | 5.481 | 0.55% | 37.192 | 3.71% | ||
| Panas | 768.855 | 29.591 | 3.85% | 162.904 | 21.19% | ||
| Poblacion | 522.393 | 1.812 | 0.35% | 23.06 | 4.41% | ||
| San Isidro | 202.583 | 1.436 | 0.71% | 19.491 | 9.62% | ||
| Tambongan | 454.057 | 8.786 | 1.94% | 80.588 | 17.75% | ||
| Tawid | 465.637 | 12.49 | 2.68% | 77.584 | 16.66% | ||
| Tubod | 291.064 | 4.057 | 1.39% | 31.94 | 10.97% | ||
| Tugas | 399.458 | 1.207 | 0.30% | 3.204 | 0.80% | ||
| Sub-Total | 10,264.69 | 12.201 | 0.12% | 535.76 | 5.22% | 1,788.49 | 17.42% |
| Calangaman Island | 5.447 | ||||||
| Catiil Island | 26.478 | ||||||
| Tabundijo Island | 8.506 | ||||||
| Inland Water | 74.017 | 0.061 | 0.08% | ||||
| Sub-Total | 114.447 | 0.061 | 0.05% | ||||
| Total | 10,453.15 | 12.201 | 0.12% | 535.76 | 5.13% | 1,788.55 | 17.11% |

